
Download as a PDF>>
Download 2018 data by jurisdiction as an excel>>
Population growth in the Washington region and all three sub-state areas slowed in 2018. The region continues to lose residents as a result of net domestic migration and 2018 marked the fifth consecutive year of losses from this component of population change. The rate of net domestic out-migration was more severe in 2018 compared to 2017, but not as sharp as in 2015 and 2016. Of the 15 largest metro areas, the region performed near the middle of the pack, ranking seventh in terms of population growth and tenth in terms of its net domestic migration rate in 2018.
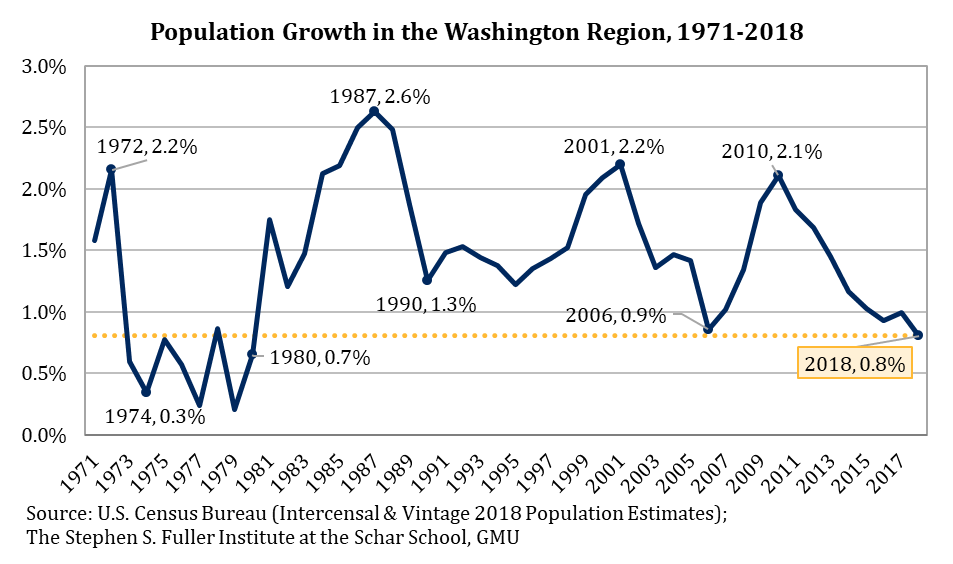
The population in the Washington region increased 0.8 percent and by 49,950 residents in 2018, marking the slowest growth for the region since 1980. Overall, population growth has slowed since peaking in 2010 at 2.1 percent. The modest improvement that occurred in 2017 (+1.0% compared to +0.9% in 2016)[1] was not sustained and the growth rate fell well below historic norms in 2018.
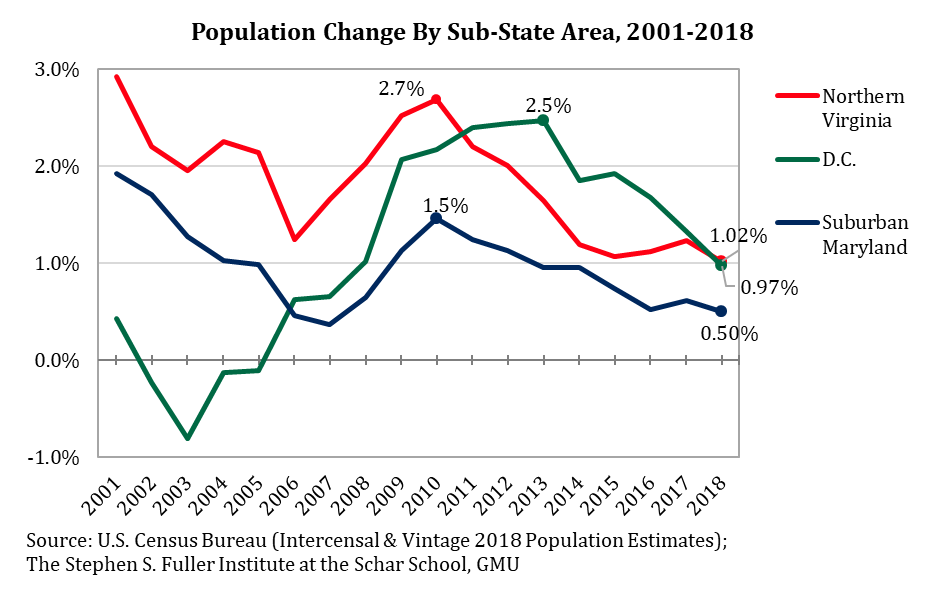
All three sub-state areas have followed a similar trajectory. The District’s persistent population declines ceased in 2006 and growth accelerated through 2013 before moderating in the ensuing years; the District’s acceleration lasted two years longer than those in Northern Virginia or Suburban Maryland and gains continued to be stronger than elsewhere in the region during the 2014-2017 period. In 2018, the population in the District increased 0.97 percent. While the gain in 2018 was strong relative to D.C.’s historic population changes, it was slightly less than Northern Virginia’s growth in 2018, suggesting that the District’s growth may more closely resemble the rest of the region’s going forward.
Population growth in Northern Virginia and Suburban Maryland peaked in 2010 at 2.7 percent and 1.5 percent, respectively. Of the sub-state areas, Northern Virginia had the strongest one-year increase during its peak, but also the most acute moderation in growth: in 2018, the population in Northern Virginia increased by 1.02 percent, a gain that was about 1.7 percentage points slower than the gain in 2010. Population growth in Suburban Maryland was the weakest of the three sub-state areas between 2006 and 2018 and fell to 0.5 percent in 2018.
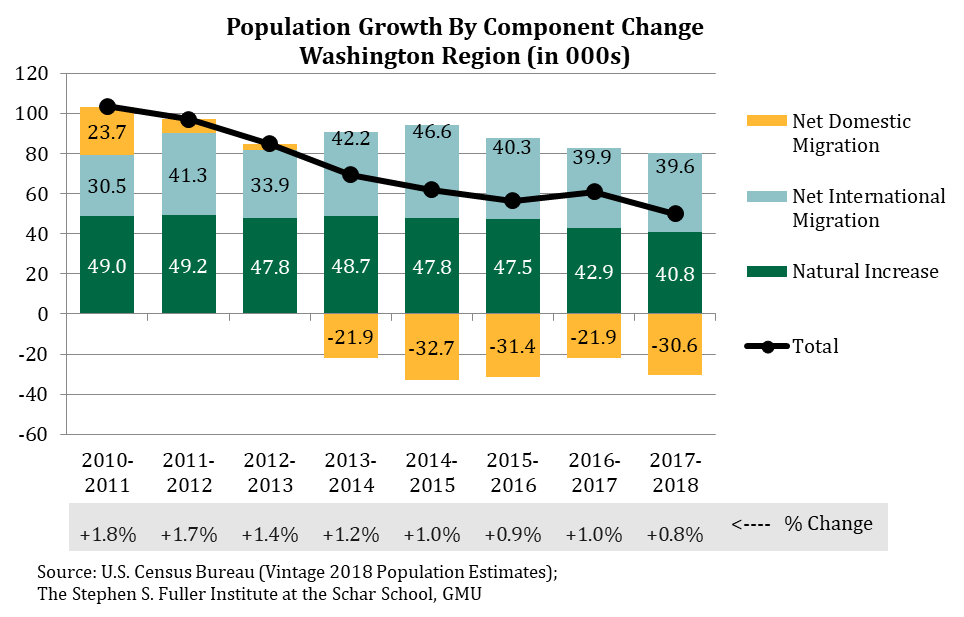
In 2018, the main source of population growth in the Washington region was the natural change, or births minus deaths. The 2018 gain of 40,780 was somewhat smaller compared to prior years as the result of both a moderation in birth rates and an increase in death rates, likely due to demographic shifts.
International migration has been a consistent source of growth for the Washington region since 2000 and was the second largest source of population growth for the Washington region in 2018; 39,620 more people moved to the region from outside the U.S. than moved out. In these data, international migration includes all people moving between the U.S. and other countries, regardless of citizenship. About 25-30 percent of the in-migrants to the Washington region in recent years were born in the U.S. or its territories and often employed by the military, the Federal government or international organizations.[2]
Net Domestic Migration
As in prior years, the slowdown in population growth was driven by net domestic out-migration and, in 2018, the Washington region had 30,580 more residents move to other parts of the U.S. than moved in. Compared to 2017, the net domestic out-migration in 2018 was more severe, although it was slightly smaller than the out-migration that occurred in 2015 and 2016.
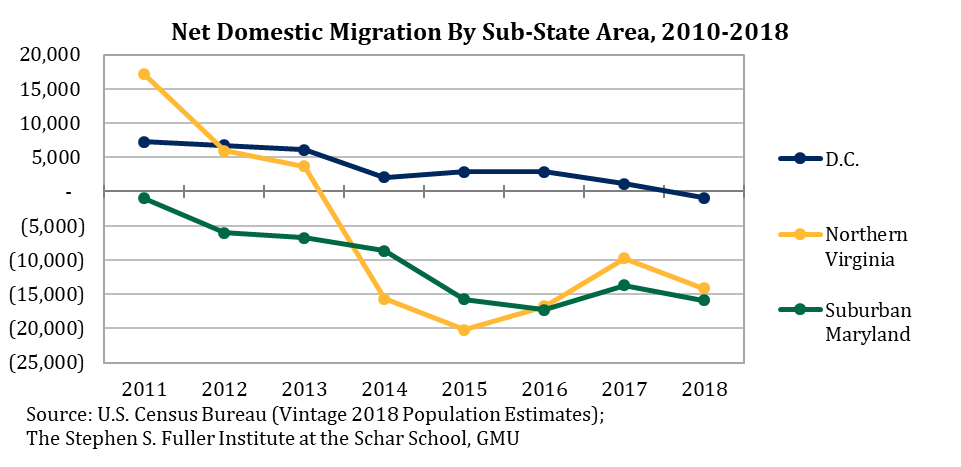
For the first time in since 2010, all three sub-state areas had net domestic out-migration. Suburban Maryland lost a net of 15,870 residents to domestic migration or 6.4 residents per 1,000 residents, the sharpest loss of any sub-state area. Suburban Maryland has had net domestic out-migration since 2010, which has been a significant contributing factor in its slower population growth compared to other parts of the region.
Northern Virginia lost a net of 14,170 residents as a result of domestic migration, or a loss of 4.7 residents per 1,000 residents. Northern Virginia has had net domestic out-migration since 2014 and has generally reflected the Washington region’s trends.
The District of Columbia lost 940 residents as a result of domestic migration, or a loss of 1.3 residents per 1,000. The District had net domestic in-migration for all years between 2010 and 2017 and the recent net out-migration is likely driven, in part, by the broader pattern of sustained out-migration for the region, overall.
Since 2000, economic conditions have corresponded with the region’s net domestic migration patterns and the acceleration in out-migration in 2018 extends this trend. In particular, out-migration has reflected the relative strength of job growth in the 44 metros with strong migration ties with the Washington region.[3] One-half (22) of these metros have historically gained residents from the Washington region, on net. When job growth in these metros is strong, the Washington region is more likely to have net domestic out-migration. In 2018, the number of jobs in these metros increased by an average of 2.3 percent, stronger than both the 2.2 percent for these metros in 2017 and the 1.1 percent growth that occurred in the Washington region in 2018.
Conversely, an additional 22 metros have historically lost residents to the Washington region, on net, through migration. When job growth in these metros pulls back compared to the Washington region, the region is more like to have net in-migration. In 2018, job growth in these metros out-performed that of the Washington region (+1.2% compared to the regions +1.1%), reinforcing the overall trend of out-migration.

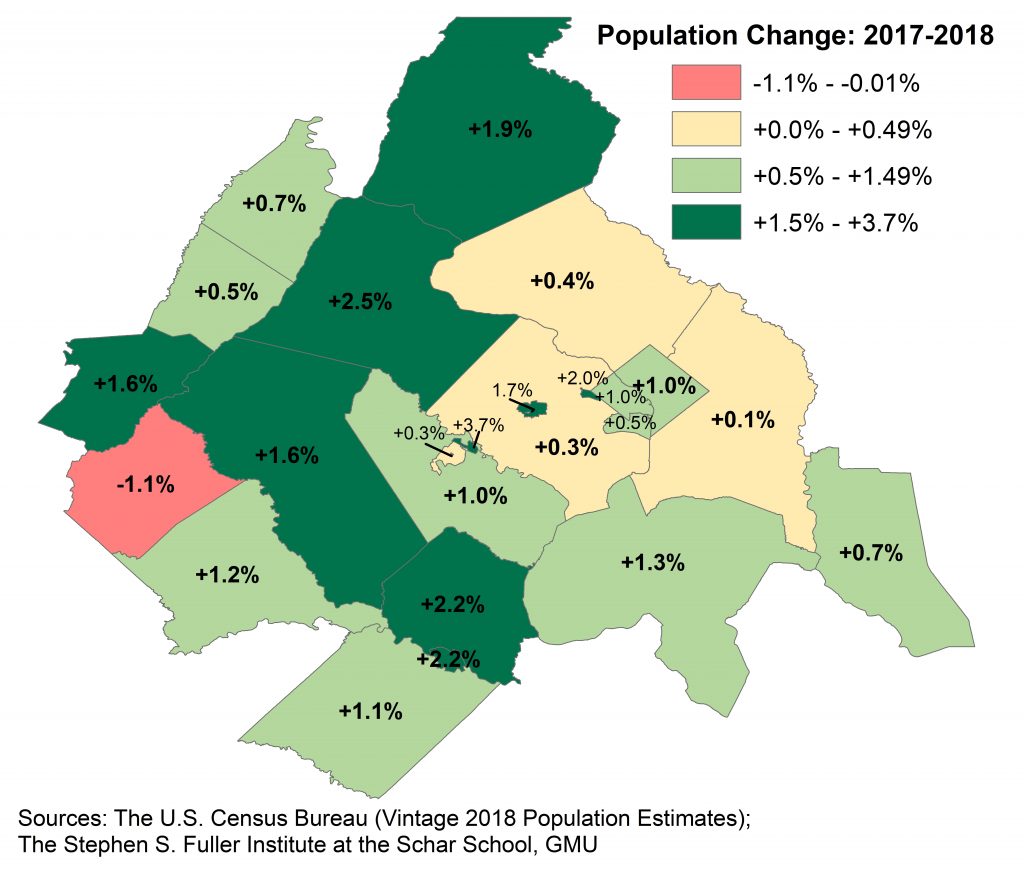
Population Change by Jurisdiction
Among the jurisdictions in the region, population growth ranged from a loss of 1.1 percent in Rappahannock County, VA to a gain of 3.7 percent in Manassas Park City, VA. The other fastest growing jurisdictions were also in Northern Virginia: Loudoun County (+2.5%), Fredericksburg City (+2.2%) and Stafford County (+2.2%). Rappahannock County was the only jurisdiction with a population decrease and had losses due to both the natural change and because of net domestic migration.
Nearly every jurisdiction had gains from the natural change. Only two jurisdictions, Clarke County, VA and Manassas Park City, VA, had minor losses from the natural change. After adjusting for population size, the rate of the natural increase was largest in Fairfax City, VA, Manassas City, VA and Alexandria City, VA.
Similarly, all but two of the jurisdictions had population growth from net international migration. Only Clarke County, VA and Jefferson, WV had minor losses as a result of this component. After adjusting for population size, the rate of the natural increase was largest in Alexandria City, VA, Manassas Park City, VA, and Fairfax City, VA.
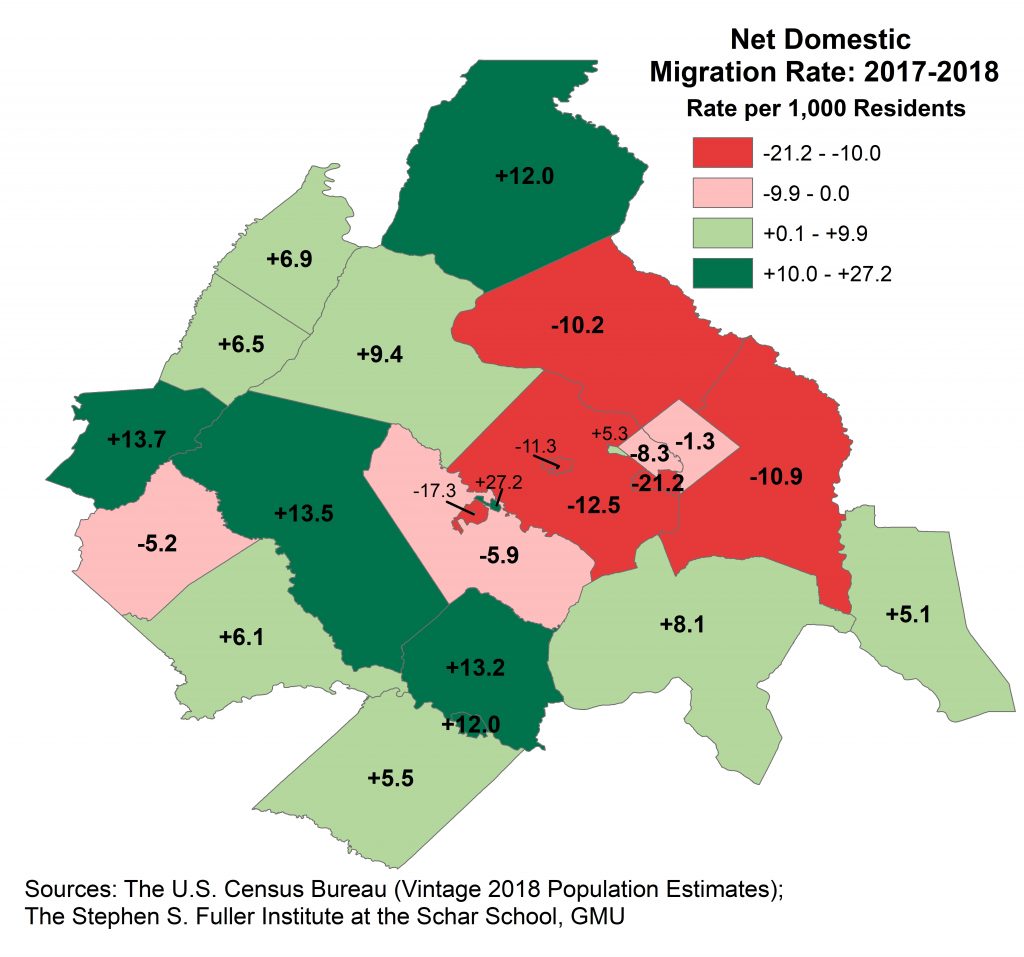
In 2018, net domestic out-migration occurred for ten of the region’s 24 jurisdictions. The largest absolute losses were in Fairfax County, VA (-14,330), Montgomery County, MD (-10,730), and Prince George’s County (-9,950). However, after adjusting for population size, the most acute loses were in Alexandria City (-21.2 residents per 1,000), Manassas City (-17.3 residents per 1,000), and Fairfax County (-12.5 residents per 1,000).
The jurisdictions with the largest absolute domestic in-migration in 2018 were Loudoun County, VA (+3,790), Frederick County, MD (+3,040), and Stafford County, VA (+1,960). After adjusting for population size, the largest rates of in-migration were in Manassas Park City, VA (+27.2 per 1,000 residents), Warren County, VA (+13.7 per 1,000 residents) and Fauquier County VA (+13.5 per 1,000 residents). Since 2010, only four jurisdictions have had consistent net domestic in-migration: Loudoun County, VA, Charles County, MD, Fauquier County, VA, and Spotsylvania County, VA.
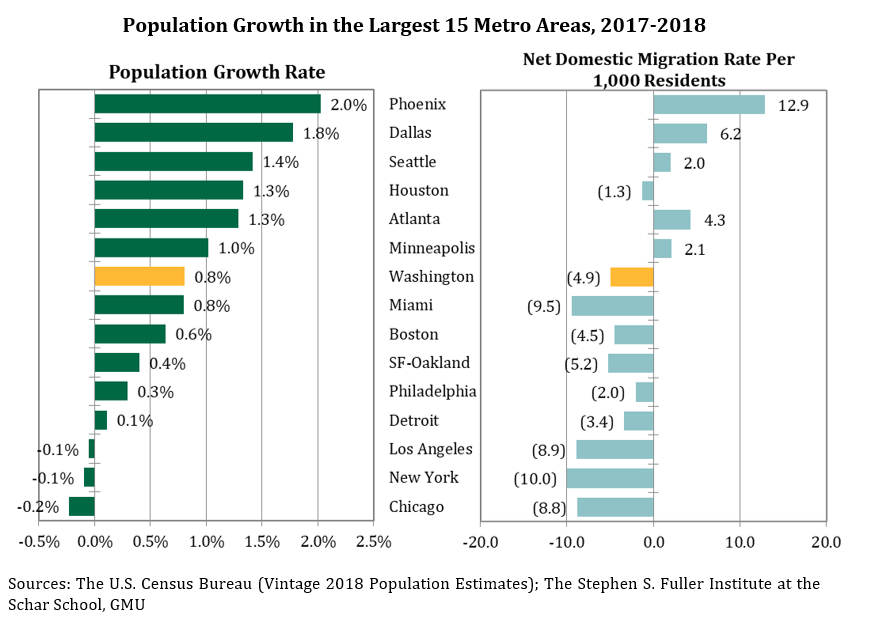
Population Change in the 15 Largest Metro Areas
The Washington region had the seventh largest percentage population growth rate of the 15 largest metros[4] in 2018. The region ranked eighth from 2014 through 2017, sixth in 2013, and fourth in both 2012 and 2011. While the Washington region’s rank for 2018 improved compared to prior years, it is primarily due to weakening population growth in other metros.
Of note, three metros had population losses. The population in the Chicago metro decreased by 0.2 percent in 2018, marking its fourth consecutive decline. The number of residents in the New York metro decreased by 0.1 percent in 2018, its second consecutive decrease. The Los Angeles metro had 0.1 percent fewer resident in 2018 compared to 2017.
Similar to the pattern in prior years, net domestic migration was positive for the three metros with the fastest population growth in 2018. Conversely, metros with higher rates of net domestic out-migration had comparatively weak overall population changes.
About These Data
Data for 2010-2018 are from the Vintage 2018 Population Estimates from the U.S. Census, released April 18, 2018. Estimates from the prior years are from the 1970-1980, 1980-1990, and 2000-2010 Intercensal Estimates. Estimates are as of July 1 for every year. The jobs data are from the U.S. Bureau of Labor Statistics as of March 22, 2019. The 2013 metro region delineations are used throughout for all metros and all years. Note that these data are revised after each Decennial Census.
[1] The growth rates for 2016 and 2017 were revised down by 0.1 percentage points from the estimates released last year.
[2] Based on analysis of American Community Survey microdata.
[3] See more on the Migration in the Washington Region page.
[4] Measured by Gross Regional Product