
The Washington region’s job growth weakened in February 2019 and this trend was reflected in each sub-state area. While the Washington region is under-performing most of its peer metros, the gains in these metros are also moderating, suggesting that national factors may also be playing a role in the Washington region’s slowdown.
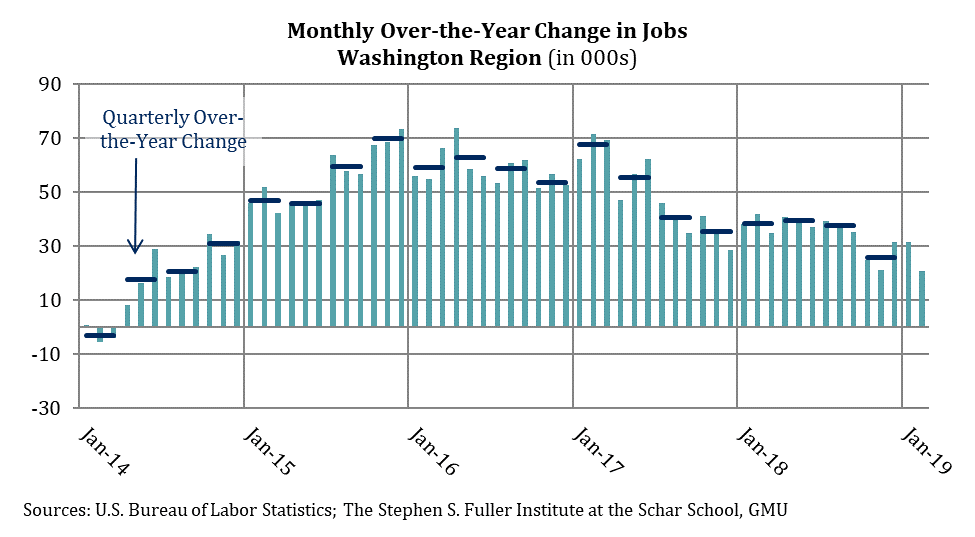
The Washington region added 20,700 jobs between February 2018 and February 2019, the smallest gain since July 2014. However, unlike the accelerating growth pattern in 2014, job growth in the Washington region has been slowing in the past half year as part of a broader trend starting in early 2017.
During 2014 and 2015, job growth in the Washington region accelerated as it recovered from Sequestration until job growth stabilized in 2016 on a monthly over-the-year basis. In 2017, the pattern reversed and job growth slowed over the course of the year. Growth stabilized again during the first three quarters of 2018 but moderated during the fourth quarter, decreasing by about one-third compared to the gains earlier in the year. The January and February 12-month gains continue the low-level of growth from fourth quarter 2018, increasing by a similar number of jobs.
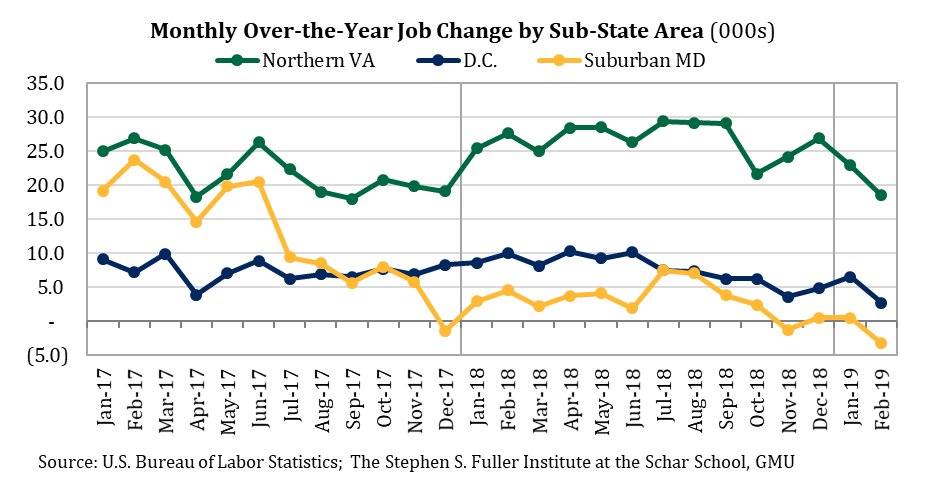
The change in jobs between February 2018 and February 2019 was weak for all three sub-state areas. Suburban Maryland continues to have the most acute deceleration: there were 3,300 fewer jobs in February 2019 compared to last February. By contrast, Suburban Maryland added 4,200 jobs on average during the first three quarters of 2018. The District added 2,700 jobs in the 12 months ending in February 2019 but had added an average of 8,600 jobs during the first three quarters of 2018. The slowdown in Northern Virginia was slightly less pronounced and gains in February were about one-third smaller (+18,500 jobs) than during the first three quarters of 2018 (+27,700 jobs).
Changing Geography of Job Growth
The Washington region is mirroring a slowdown that has occurred in the largest 15 metro areas, although the Washington region continues to lag compared to the majority of these metros. While a similar slowdown has occurred nationally, it has been more acute in the major metro areas and this geographic pattern of job growth most closely resembles the period between 1996 and 2000.
In the largest metro areas except the Washington region (the other largest metros), job growth peaked in 2015 and increased by 2.5 percent, overall. Growth gradually stepped down, slowing to 2.2 percent in 2016, 1.7 percent in 2017 and 1.6 percent in 2018. In February 2019, the number of jobs in the other largest metros increased 1.3 percent from last February.

In the Washington region, the trajectory prior to 2016 differed from the other large metros because of Sequestration. However, since 2016, the Washington region has mirrored their slowdown in growth: 1.9 percent in 2016, 1.5 percent in 2017, 1.1 percent in 2018 and 0.6 percent in February 2019. Overall, the Washington region has under-performed its peer metros annually since 2011 and this trend has extended into 2019 so far.
Between 2011 and 2017, job growth in the largest 15 metros was stronger than elsewhere in the U.S. The number of jobs in the largest metros increased more than 2.1 percent per year over this period compared to an increase of nearly 1.6 percent per year for the rest of the U.S, a difference of 0.6 percentage points. In 2018, the growth rates in these areas began to converge and the large metro advantage weakened to 0.2 percentage points: the number of jobs in the largest metros increased by 1.6 percent compared to 1.4 percent in the rest of the U.S. So far in 2019, the difference between growth rates in the largest metros and elsewhere in the U.S. has been 0.1 percentage points as job growth continues to converge.

The last expansionary period in which a similar pattern occurred was from 1996 into 2000, but the pattern was shorter and the differences were smaller. Between 1996 and 1998, the number of jobs in the largest metros increase by 3.0 percent annually compared to 2.5 percent in the rest of the U.S., a difference of 0.5 percentage points. In 1999, the difference in the growth rates between the largest metros and the rest of the U.S. was 0.3 percentage points and by the spring of 2000, the difference was 0.1 percentage points. In the year before the recession, though, the largest metros strengthened modestly and out-performed the rest of the U.S.
by 0.4 percentage points.
The weakness in job growth in the Washington region in February reflected both regional and national conditions partly stemming from an aging business cycle, which will be the second longest on record if it extends into the middle of 2019. Regionally, the recent declines in the Washington Leading Index point to slower economic growth in 2019, a trend that the recent jobs data may already be capturing.
About These Data
All data are from the U.S. Bureau of Labor Statistics (Current Employment Statistics State & Local Area, Not Seasonally Adjusted) released March 22, 2019. Metropolitan statistical areas are defined as of 2013 for all time periods. The largest employment metros are defined by the Gross Regional Product in 2017 and do not change over time. The CES State & Local Area estimates are used throughout; due to the estimation methodology, an increasing share of the job growth reported by the CES National estimates since May 2018 are not attributable to a geography, artificially increasing the differences between gains in the largest metros and the rest of the U.S. Recession months are from the National Bureau of Economic Research.