
REGIONAL ECONOMIC NOTE No. 24-03
Keith Waters and Terry Clower
Download Full Economic Note as a PDF >>
The Census Bureau recently released sub-state population estimates. This regional economic note examines population changes from 2022 to 2023 while placing the changes in the context of recent trends for the Greater Washington region. This paper uses the Washington, DC Metropolitan Statistical Area defined by the OMB on March 6th, 2020. Overall, while the population of the Washington region increased, this was the result of increased international in-migration. Domestic out-migration remains problematic for the region. While domestic out-migration slowed during the most recent data period, it remains sharply elevated over pre-pandemic levels. Geographically, close-in suburban jurisdictions continue to record notable domestic out-migration. Domestic out-migration continues to indicate that the Washington region’s economy remains uncompetitive with many peer metropolitan areas, a fact that is masked by increased international in-migration to this region.
Population Change
As of July 2023, the Washington region had a population of 6,413,831. This was an increase of 39,373 from 2022 to 2023, its largest year-over-year population increase since 2018 to 2019 and the reversal of a trend of slowing growth that started in 2011. In percentage terms, the Washington region’s population increased 0.6 percent from 2022 to 2023, also the largest percentage increase since 2018-2019.

Before the pandemic, there was a steady trend of slowing population growth. Extending a linear trend from 2010 to 2019 through 2023 suggests that the population growth from 2022 to 2023 would have been relatively flat at 0.04 percent, instead of the recorded positive 0.66 percent. While the recorded growth rate was higher than the trend would have predicted, the actual growth rate in 2021 and 2022 was far lower than the trend would have predicted. While the most recent data provides some hope that pandemic disruptions to population change have ended, it seems plausible that the future trajectory of the regional population growth will be determined by policy choices at the national and local levels.
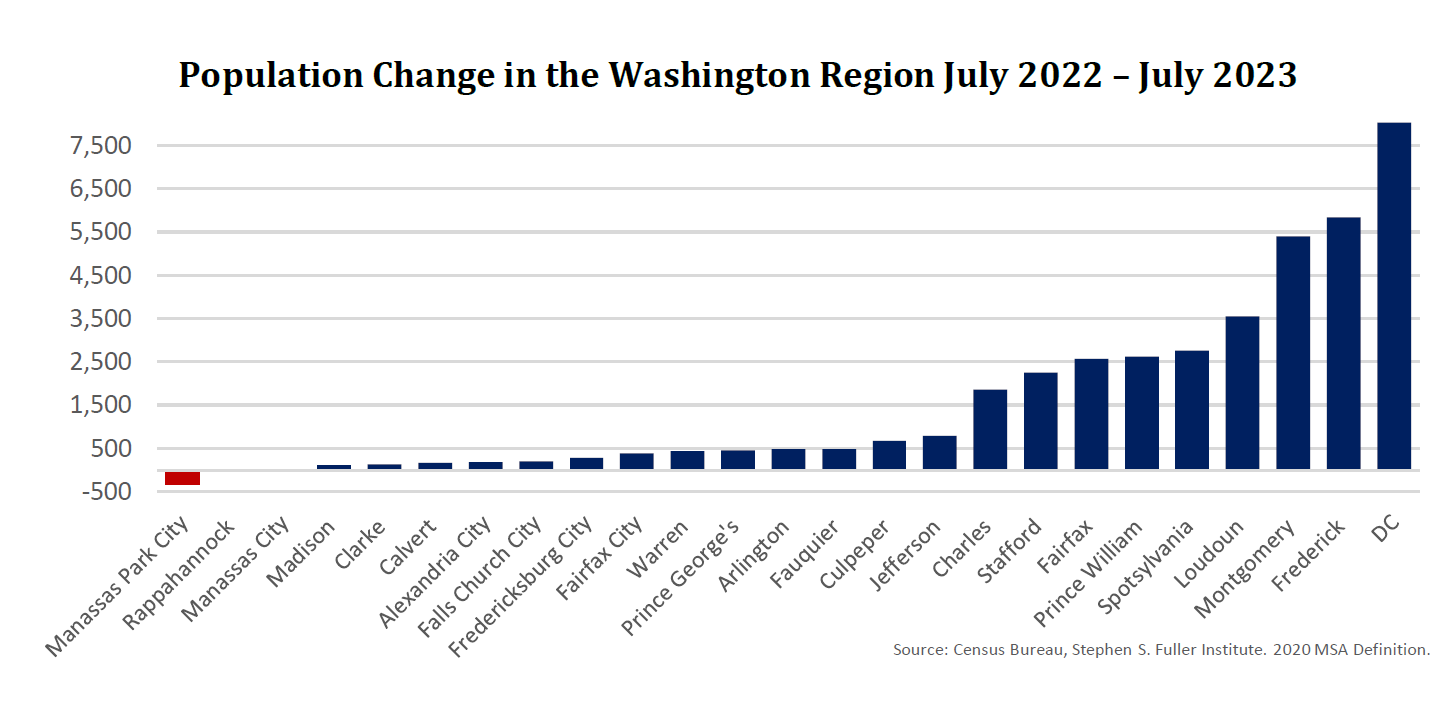
From 2022 to 2023, almost every jurisdiction in the Washington region recorded population growth. The District of Columbia recorded the largest population increase, adding 8,023 people from 2022 to 2023. Frederick County, MD added the second most, with 5,851 new residents over the period. Other large increases included Montgomery County, MD (+5,407); Loudoun County, VA (+3,555); Spotsylvania County, VA (+ 2,760); Prince William County, VA (+2,628); Fairfax County, VA (+2,569); and Stafford County, VA (+2,259). Notably, Prince George’s County, MD, the third largest jurisdiction, only increased its population by 450 people.
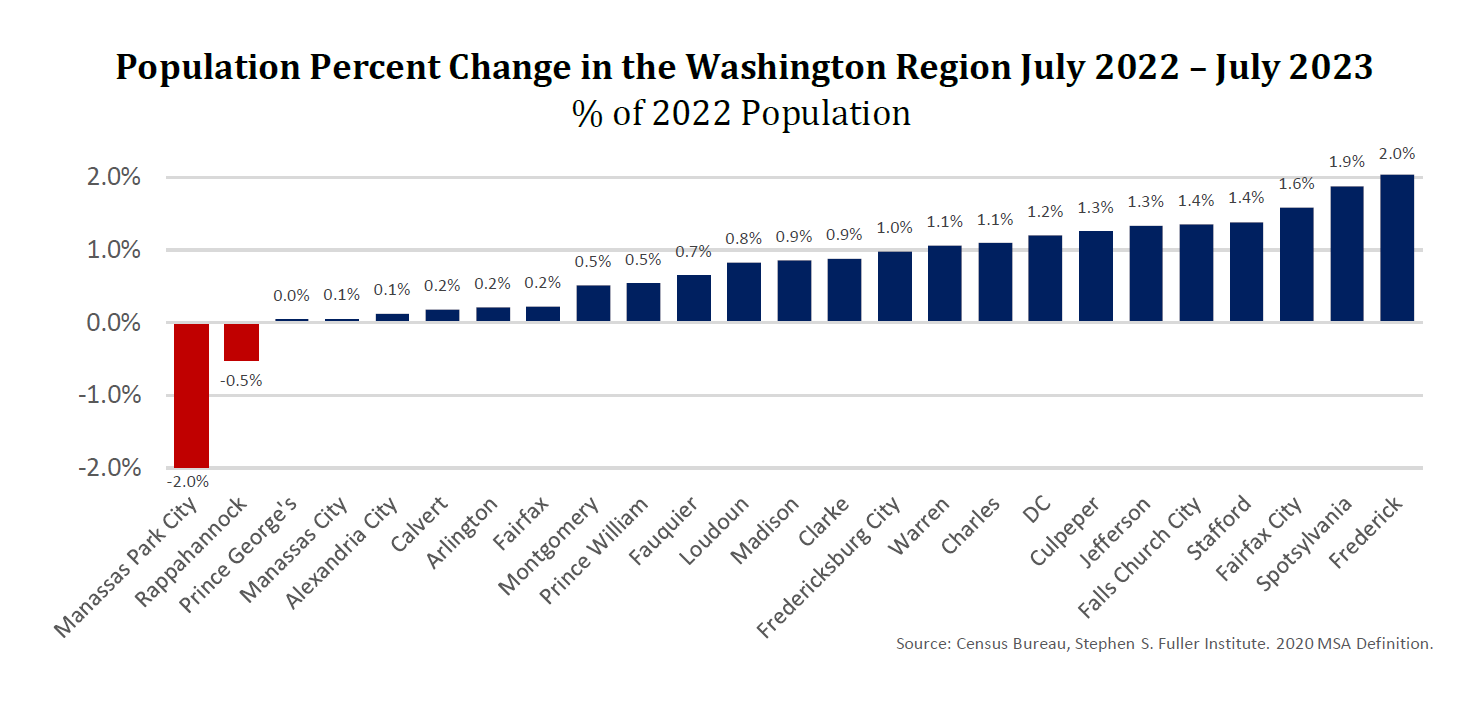
In percentage terms, population change in the most recent data period ranged from -2.0 percent to 2.0 percent. Only Manassas Park City had a notable population loss (-2.0%). While DC had the largest population growth by headcount, it was a 1.2 percent increase – better than the regional average but still middle of the pack. The jurisdiction with the largest percentage increase was Frederick County, MD (+2.0%). The next largest population percentage increases were Spotsylvania County, VA (+1.9%); Fairfax City, VA (+1.6%); Stafford County, VA (+1.4%) and Falls Church City, VA (+1.4%). While Montgomery County, MD had the second largest population increase, it represented only a 0.5 percent increase from its 2022 population. Fairfax County, VA had a similarly muted population percent increase of just 0.2 percent. In percentage terms, Prince George’s County, MD was effectively flat at 0.05 percent from 2022 to 2023.
Components of Change
Examining the components of change reveals that the population increase in the Washington region was the result of notable increases in international in-migration and reduced, but persistent, domestic out-migration. The rate of domestic out-migration slowed in the most recent data period but was still elevated by historic standards at -40,971. International in-migration, which averaged over 40,000 annually in the early half of the 2010’s declined to just 16,959 in 2021 due to federal policies and COVID restrictions. However, with the change in federal administration policies and COVID restrictions removed, international immigration increased to 47,694 from 2022 to 2023, the largest year-over-year increase in over 14 years. Overall, strong international in-migration is masking regional weakness as domestic migrants continue to choose to relocate to other regions of the U.S.

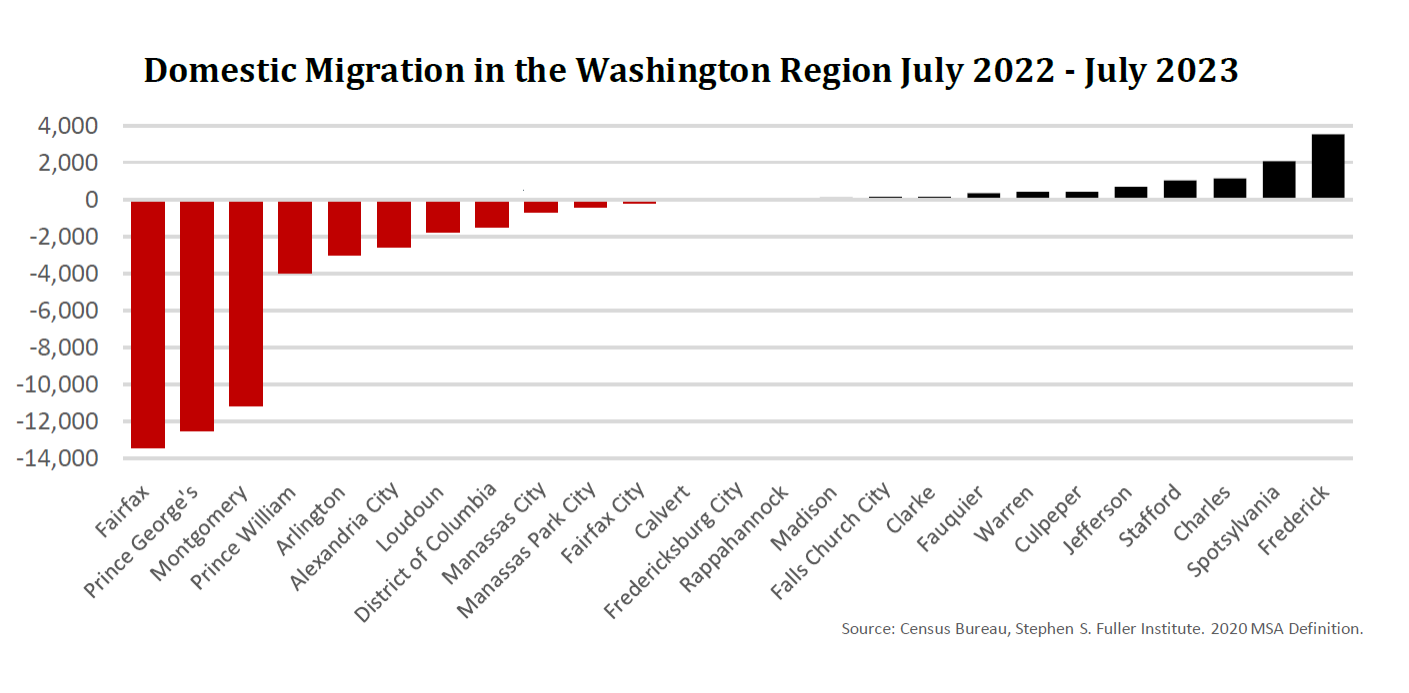
Examining net domestic migration by jurisdiction reveals that the largest suburbs continue to be economically unattractive to people already living in the United States. From 2022 to 2023, Fairfax County, VA lost 13,405 net domestic migrants. The next two largest outflows of domestic migrants were from Prince George’s County, MD, and Montgomery County, MD which lost 12,516 domestic migrants and 11,153 domestic migrants, respectively. In comparison, the District of Columbia only lost 1,509 domestic migrants. Two jurisdictions that recorded notable net domestic in-migration were Frederick County, MD, and Spotsylvania County, VA, with net domestic in-migration of 3,551 and 2,102, respectively. Overall, the large core suburbs have continued to see an outflow of domestic migrants, indicating that they remain economically uncompetitive relative to alternative regions of the country.
Domestic migration for the Washington region by jurisdiction shown on a map reveals the striking pattern that all of the net domestic in-migration within the Washington region occurred in the exurban areas. Among the thirteen exurban jurisdictions that recorded net domestic in-migration, Frederick County, MD; Spotsylvania County, VA; Charles County, MD; and Stafford County, VA, accounted for 76.7 percent of the total within-region population shift. These jurisdictions are reflecting market changes due to remote and hybrid work. Long commutes become tolerable when the frequency of commuting declines allowing households to take advantage of housing cost savings available in more remote jurisdictions.

Finally, Fairfax County, VA, and Montgomery County, MD are compared to other jurisdictions with over one million people. Of the forty-eight counties in the United States with over a million people, thirty-five had net domestic out-migration. Jurisdictions with the largest net domestic out-migration as a share of the total 2022 population were Bronx County, NY (-3.0%); Queens County, NY (-2.2%); Kings County, NY (-2.1%); and Miami-Dade County, FL (-1.8%). Fairfax County, VA, and Montgomery County, MD had the 11th and 14th largest net domestic outflows as a percent of the population among those that lost domestic migrants.
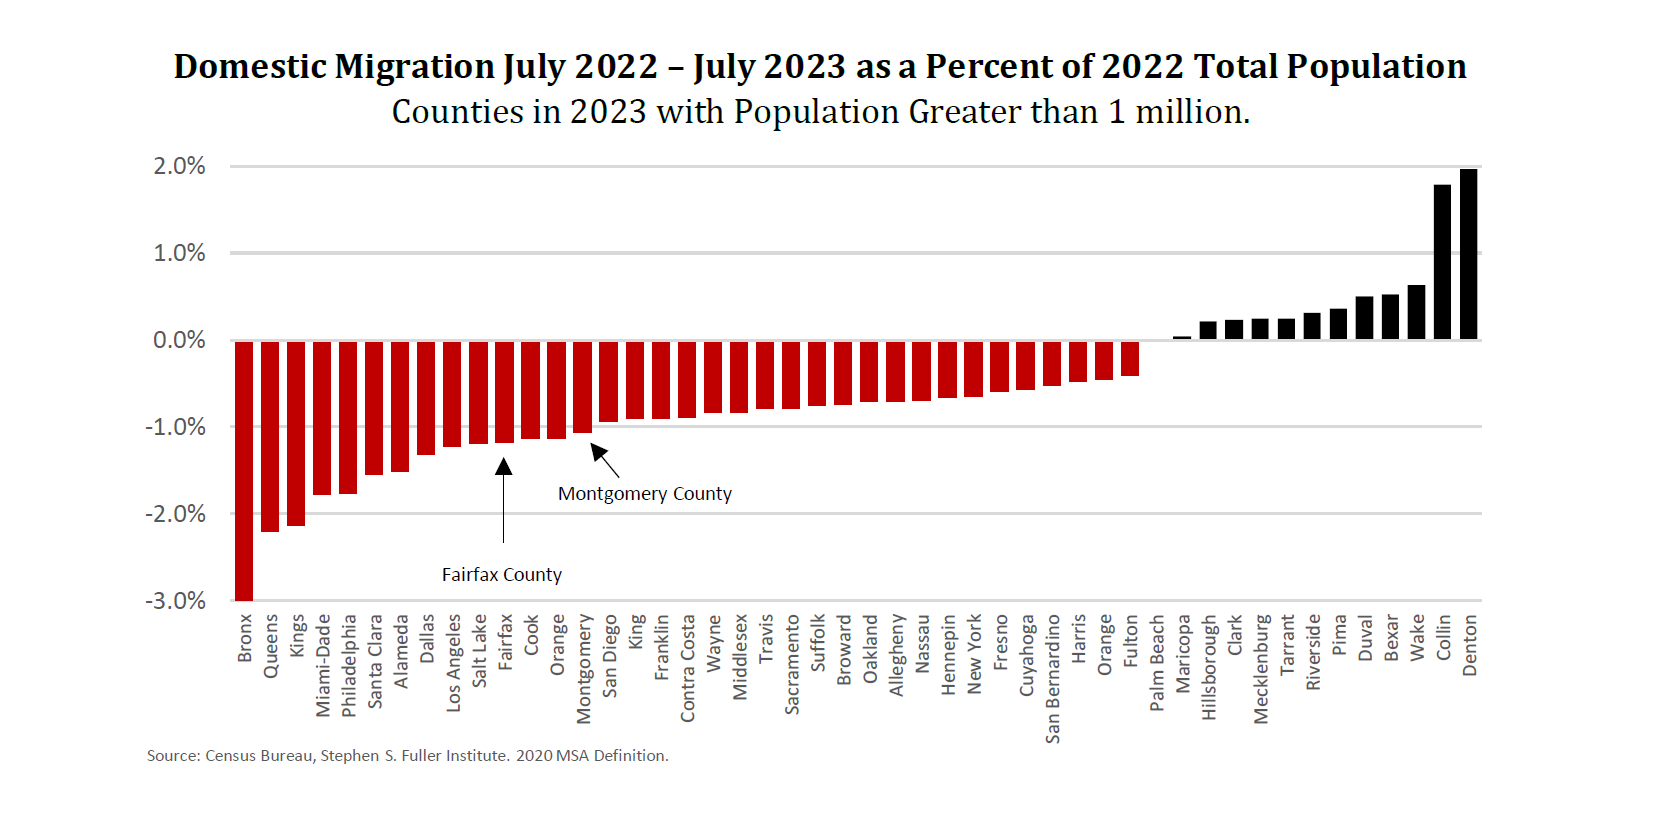
The two counties that recorded notable domestic in-migration were Denton County, TX (+2.0%); and Collin County, TX (+1.8%). No other jurisdiction with more than a million people added more than 1 percent in net domestic migration. It is notable that compared to data from prior years, Florida’s largest counties are no long prominent among growth areas.
Conclusion
The population of the Washington region grew from 2022 to 2023, primarily due to an increase in international migration and a decrease in domestic out-migration. International migration had reduced during the years 2016 to 2020 due to federal immigration policies and later COVID restrictions. However, as the federal administration changed and the COVID restrictions were lifted, international in-migration increased. Net-domestic out-migration slowed from sharply elevated levels from 2021 to 2022 but remained 42.1 percent higher than pre-pandemic levels. Large suburban jurisdictions continue to record large domestic population losses even as domestic out-migration for DC has slowed considerably. Overall, population change data suggest the Washington region remains economically unattractive compared to competing regions for US residents, and the result is domestic out-migration from the region with implications for workforce availability and economic growth.
About These Data
All data in this report use the MSA definition released by the Office of Management and Budget March 6, 2020. Population estimates from 2020-2023 come from the Vintage 2023 data from the U.S. Census Bureau Population Estimates Program released March 2024 (CO-EST2023-ALLDATA). This vintage includes population estimates as well as components of change for the years 2020 to 2022. The data are revised from the base year (e.g., 2020) and July 1st of the current year. While the decennial Census typically provided the base, a modified base was used for 2020 due to various issues including the COVID-19 pandemic. Population estimates marked 2010-2011 through 2019-2020 come from the county population estimates released May 2021 (CO-EST2020-alldata). Each new vintage supersedes previous vintages. Although estimate errors increase as time from the base year increases meaning that 2020 estimates from prior to the 2020 Census will not align with those after the 2020 Census, we provide estimates from the May 2021 dataset to compare pre-pandemic domestic migration trends. Births and Deaths data come from the National Center for Health Statistics. Migration estimates are derived from Internal Revenue Service tax data, Medicare enrollment data, and Social Security Administration Data. Group Quarters data are estimated using data from the military, the Department of Veterans Affairs, and state partners. Population estimates are from the period July 1st to July 1st. For example, July 1st, 2020 to July 1st, 2021. However, Natural increases, domestic migration, and international migration are from the period July 1st through June 30th. For example, July 1st, 2020 to June 30th, 2021.