
Download the report, “The Washington Region’s Population Increased 1.1 Percent in 2017” as a PDF>>
Download 2017 data by jurisdiction as an excel>>
Population growth in the Washington region stabilized in 2017 and was modestly stronger than in 2016. Our region continues to lose residents to other parts of the nation, although the loss in 2017 was less severe than the losses in prior years. The moderating net domestic out-migration is likely the result of a slowdown in job growth in key metro areas that has likely diminished their relative attractiveness to potential out-migrants. Net international migration became the largest source of growth in 2016, surpassing the natural increase (births minus deaths).[1] Compared to the other 15 largest metro areas, the region continues to rank near the middle of the pack with the seventh fastest population growth and the ninth largest net domestic migration rate in 2017.
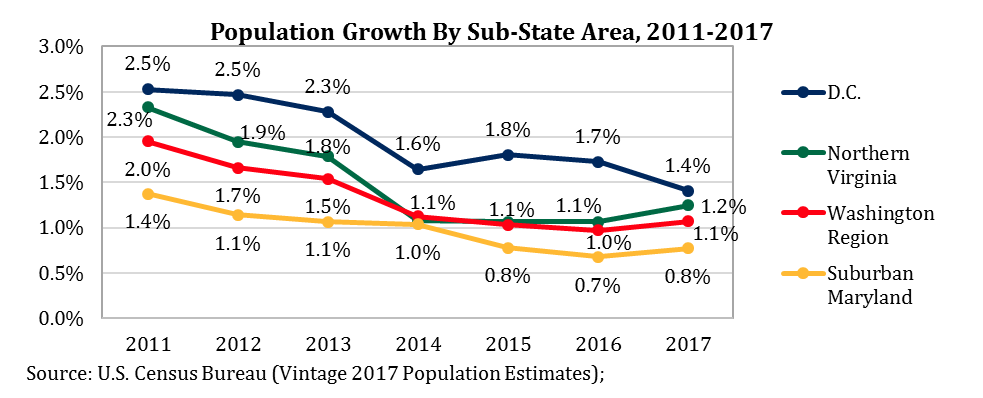
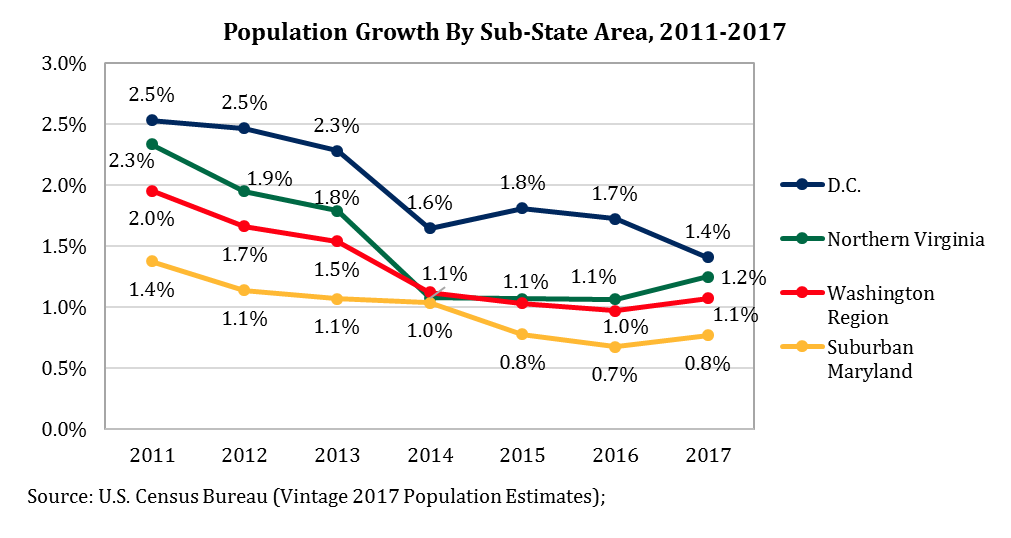
In 2017, the Washington region’s population increased 1.1 percent or by 65,910 residents. This increase is 0.04 percentage points larger than the gain in 2016 and is the first year since 2010 that population growth has not weakened compared to the prior year. The reversal was driven by relatively larger gains in Northern Virginia and Suburban Maryland compared to 2016. The number of residents in Northern Virginia increased 1.2 percent (+36,890 people), reaching its fastest growth rate since 2013. Similarly, Suburban Maryland had the largest population growth rate since 2015, rising 0.8 percent in 2017. Population growth in the District of Columbia continued to be relatively stronger than those in the other sub-state areas but also continued its downward trend; in 2017, the number of residents in the District increased 1.4 percent, the smallest gain since 2008.
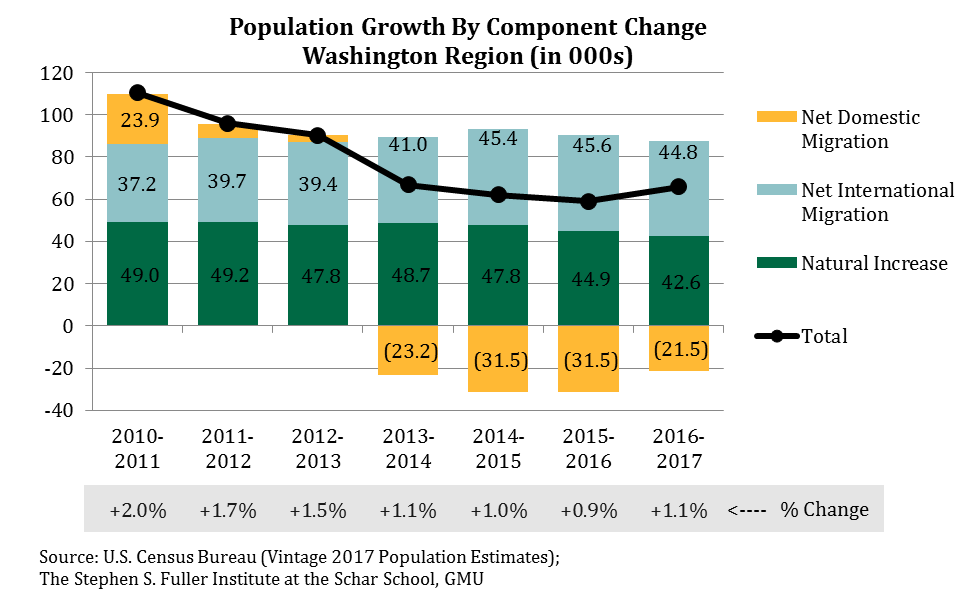
For the region overall, net international migration was the largest source of population growth for the region in both 2016 and 2017 and has been a consistent source of growth in the past seven years. In 2017, the region gained a 44,760 residents as a result of net international migration, or a rate of 7.2 residents per 1,000 residents. Net international migration rates have been between 6.5 and 7.5 since 2011 and this component has been the most stable for the region during this time. Additionally, net international migration rates were consistent across sub-state areas in 2017: Suburban Maryland (7.6 residents per 1,000 residents), Northern Virginia (7.4 per 1,000), D.C. (6.0 per 1,000).
The natural increase, births minus deaths, was the second largest source of growth in 2017. The gain resulting from the natural increase has decreased slightly since 2011 as the result slightly increased death rates and decreased birth rates. In 2011, the region added 49,020 residents from the natural increase, a gain of 8.6 per 1,000 residents. In 2017, the region added 42,610 residents from the natural increase, or 6.9 residents per 1,000.
Net international migration was the largest source of population growth for the region in both 2016 and 2017 and has been a consistent source of growth in the past seven years. In 2017, the region gained 44,760 residents as a result of net international migration, or a rate of 7.2 residents per 1,000 residents. Net international migration rates have been between 6.5 and 7.5 in the past seven years and this component was the most stable for the region during this time. Additionally, net international migration rates were stable by sub-state area in 2017: Suburban Maryland (7.6 residents per 1,000 residents), Northern Virginia (7.4 per 1,000), D.C. (6.0 per 1,000).
The natural increase, or births minus deaths, was the second largest source of growth in 2017. The gain resulting from the natural increase has decreased slightly since 2011 as the result of minor increases in death rates and decreases in birth rates. In 2011, the region added 49,020 residents from the natural increase, a gain of 8.6 per 1,000 residents. In 2017, the region added 42,610 residents from the natural increase, or 6.9 residents per 1,000.
Net Domestic Migration
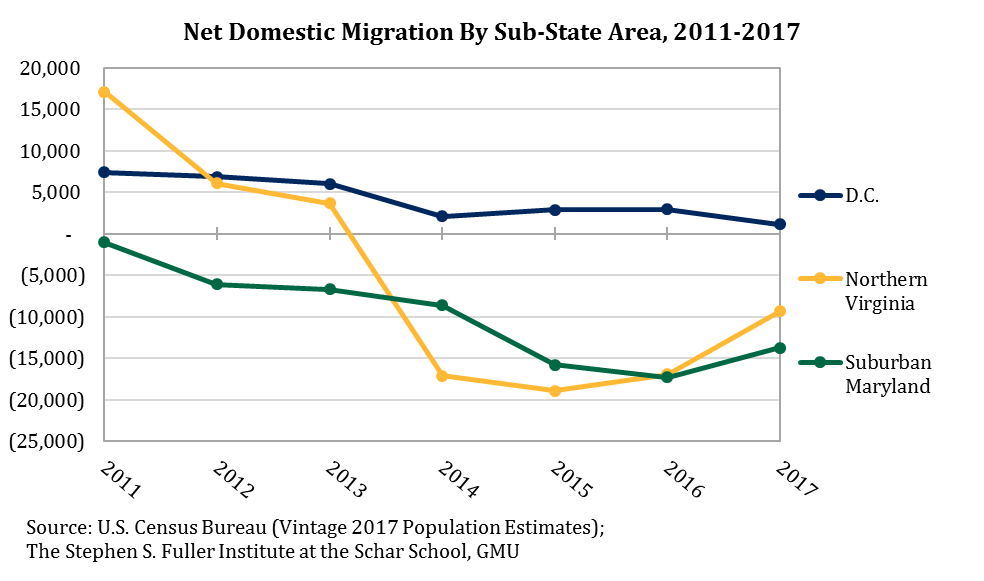
The modest improvement in population growth was due to less net domestic out-migration in 2017 compared to prior years. In 2017, 21,540 more people moved out of the region to elsewhere in the U.S. than moved in, a loss of 3.5 residents per 1,000 residents. For comparison, in 2016 the region lost 5.1 residents to net domestic out-migration per 1,000 residents.
In 2017, Suburban Maryland lost 13,740 residents to net domestic migration or 5.6 residents per 1,000 residents, the sharpest loss of any sub-state area. However, these losses were milder than in 2016, when Suburban Maryland lost 17,300 residents (7.1 residents per 1,000 residents). Net domestic migration in Northern Virginia resulted in a loss of 9,350 residents (3.1 per 1,000), or about one-half the size of the losses in 2016. Net domestic migration in the District has remained positive but the gains have moderated since 2011. In 2011, the District added 7,410 residents from net domestic migration (12.1 residents per 1,000 residents). In 2017, the District gained just 1,150 residents from net domestic migration (1.7 per 1,000).
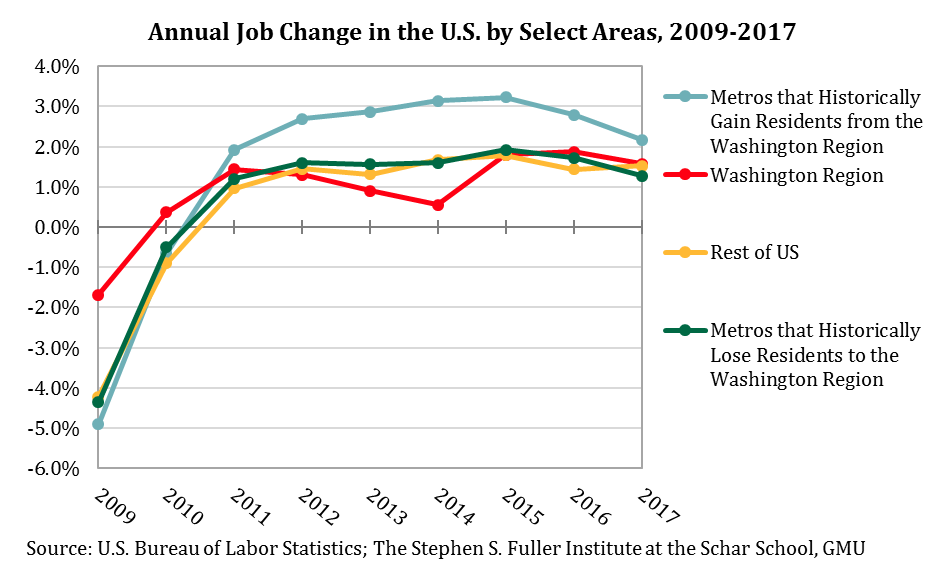
In general, domestic migration to and from the Washington region is tied to the economic performance of the nation and, in particular, of the key metro areas with which it trades population. The Washington region has historically had strong migration ties with 44 metro areas that accounted for about one-half all the migration flows both to and from the Washington region between 2000 and 2015.These metros include 22 that have historically lost population to the Washington region, on net, and 22 that have historically gained population from the Washington region, on net. (Read more about Migration in the Washington Region.)
Gross migration outflows from the Washington region had the largest fluctuations between 2000 and 2015, while gross inflows remained relatively stable. Outflows increased when the national economy and the economies of the key migration metros were gaining strength. Conversely, gross migration outflows slowed when the economies of these metros pulled back.
Job growth in the metros with strong migration ties to the Washington region is shown below. Job growth in these metros peaked in 2015 and has had a downward trajectory through 2017. The downward trend is most pronounced in the 22 metros that have historically gained net residents from the Washington region. This downward trajectory and the overall convergence of growth rates suggests that historic patterns are likely continuing: the economic factors that induce potential out-migrants to leave may be diminishing as a result of the slowdown in job growth in metros that they have historically left for.
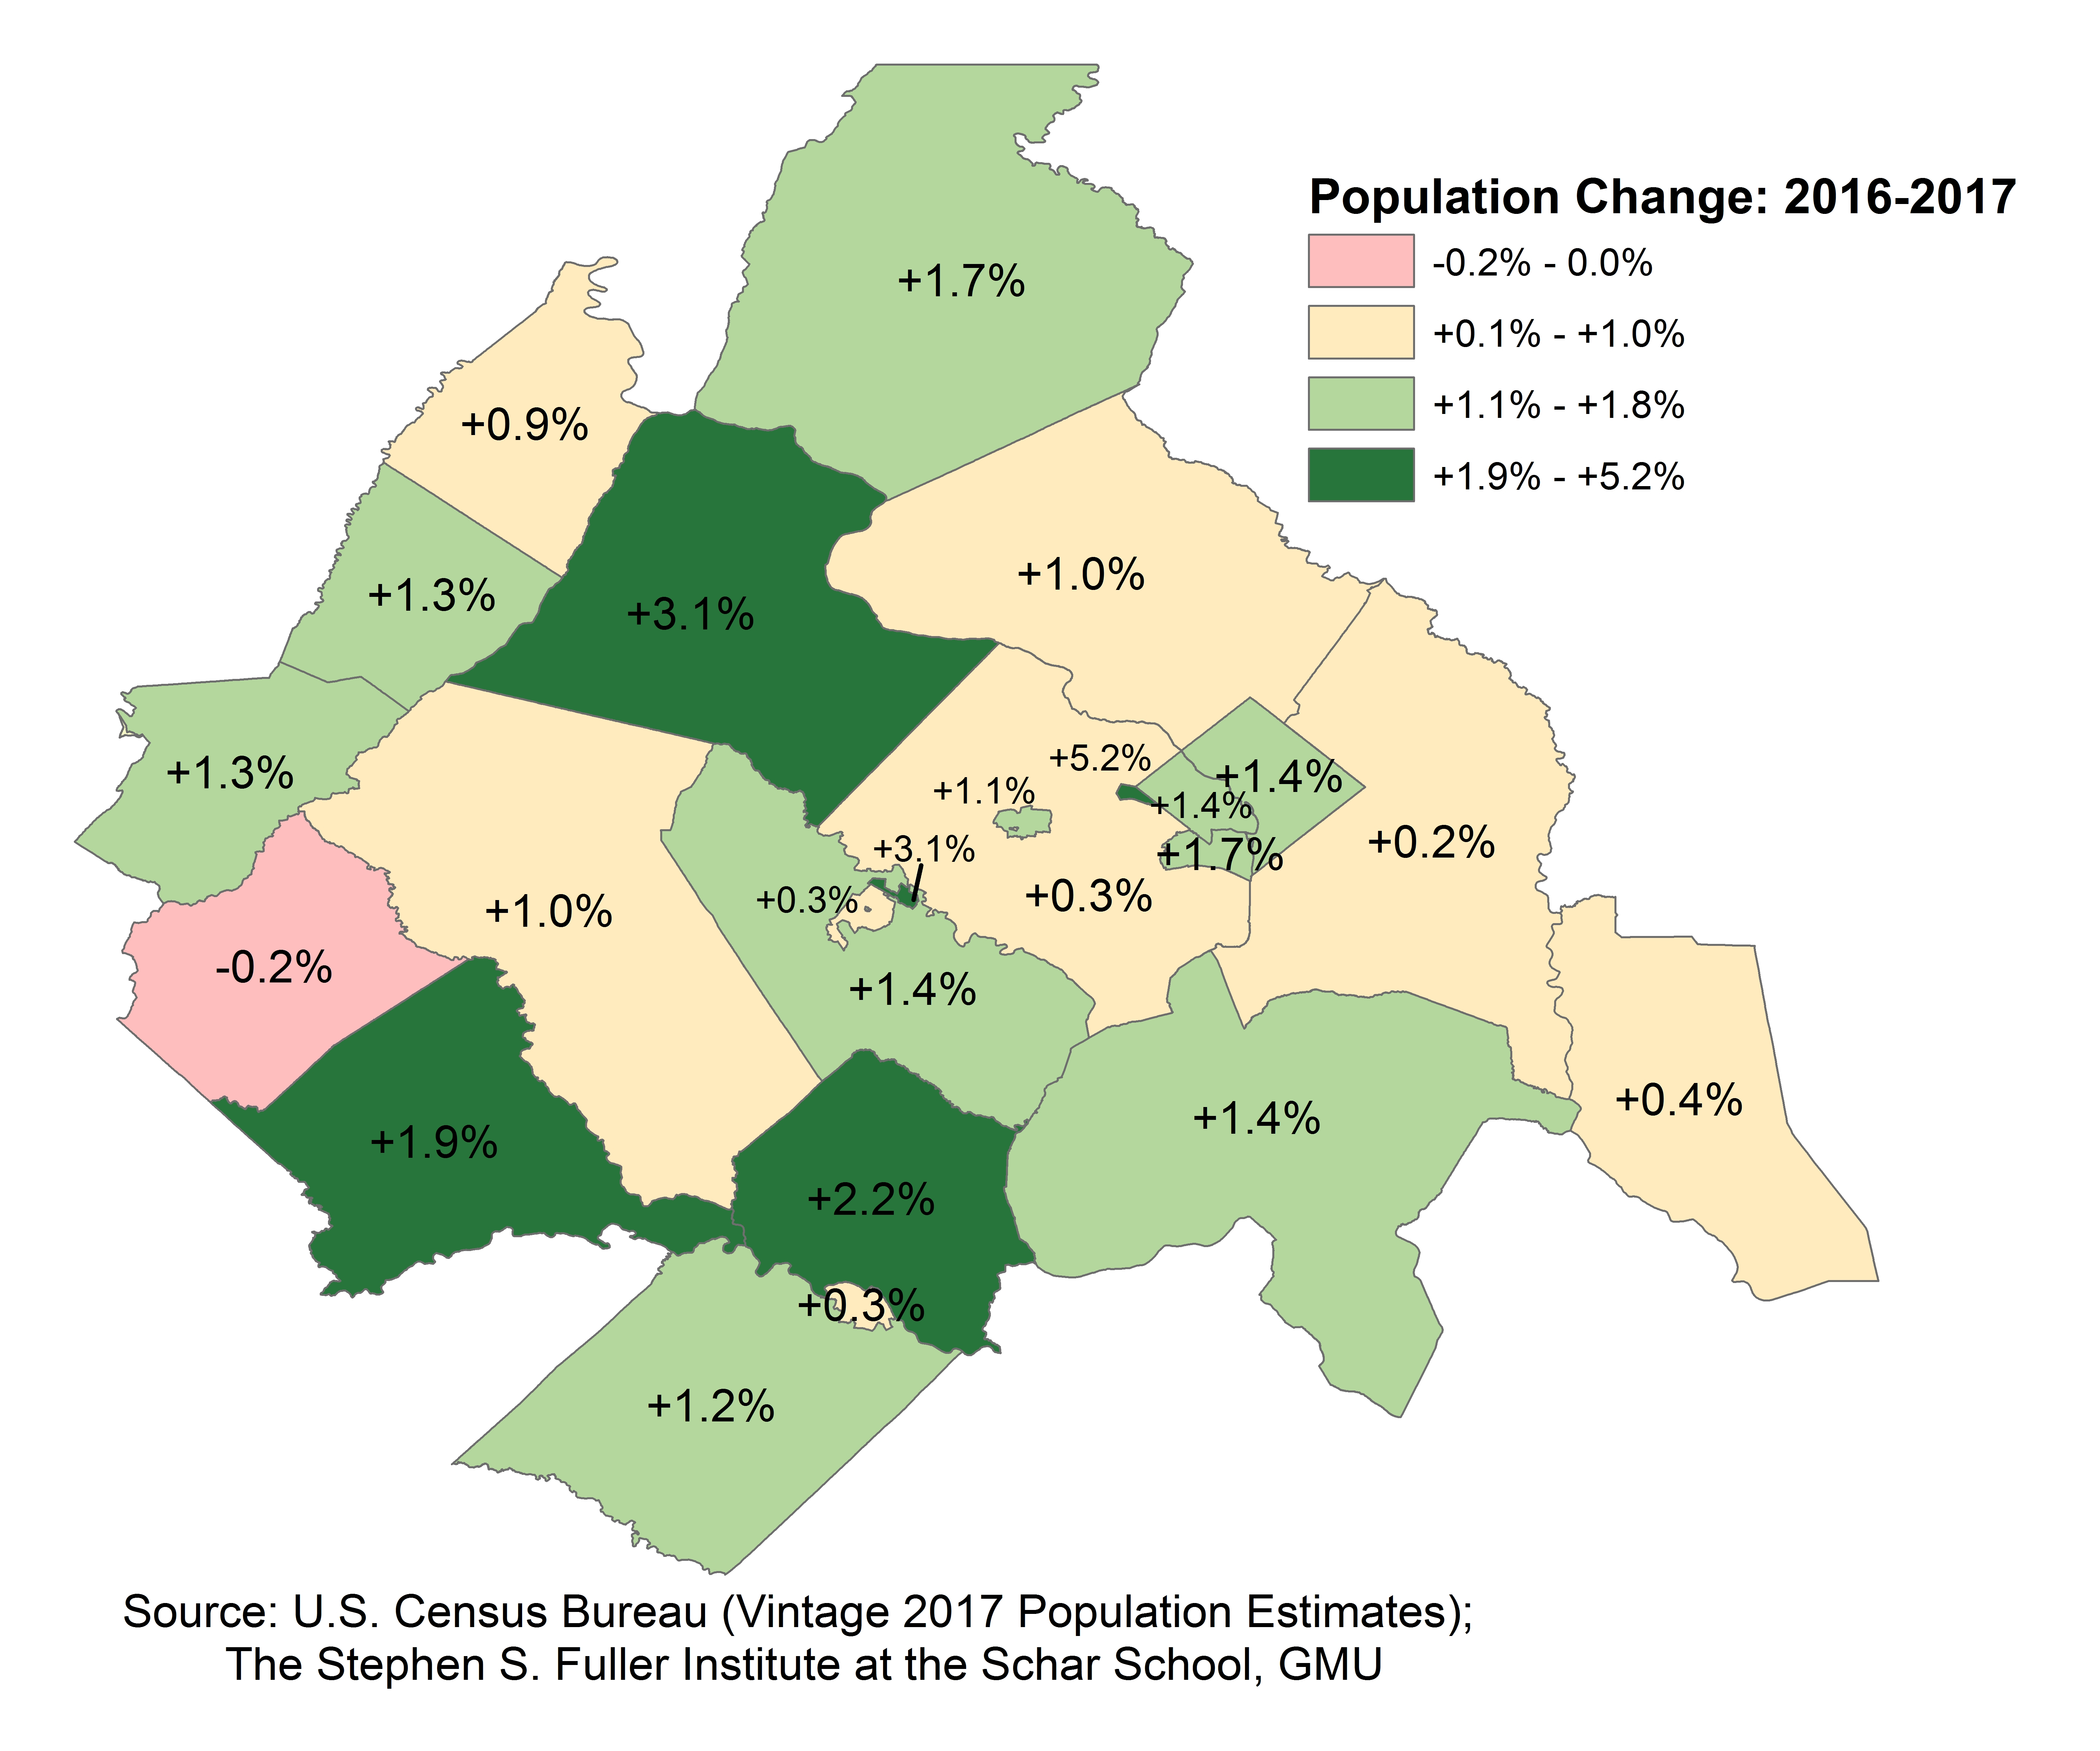
Population Change by Jurisdiction
Within the region, population growth in 2017 ranged from a decrease of 0.2 percent in Rappahannock County, VA to an increase of 5.2 percent in Falls Church City, VA. The second largest percentage increase occurred in Manassas Park City, VA (+3.1%), followed by Loudoun County, VA (+3.1%). Loudoun County, VA led in absolute gains and added 11,800 residents in 2017. Montgomery County, MD had the second largest absolute increase (+10,480), followed by the District (+9,640). (Download an excel with data by jurisdiction.)
Every jurisdiction in the region added residents as a result of net international migration except for Rappahannock County, VA which had a net loss of one resident. After normalizing for the population size, Alexandria City, VA had the largest rate of net international migration and added 15.2 residents per 1,000 people as a result of this component. Falls City, VA had a rate of 11.0 and Montgomery County, MD had a rate of 10.5, ranking second and third highest, respectively.
The natural increase was not a consistent source of growth throughout the region; Rappahannock County, VA Manassas City, VA and Clarke County, VA had more deaths than births, resulting in population losses in the natural increase component. The highest birth rates were in Fairfax City, VA (27.5 births per 1,000 residents), Manassas City, VA (18.1) and Alexandria City, VA (17.9). Relatively fewer deaths occurred in Manassas Park City, VA (2.6 per 1,000 residents), Loudoun County, VA (3.8) and Manassas City, VA (3.9). Combined, the rates of natural increase were relatively large in Fairfax City, VA (17.0), Manassas City, VA (14.2) and Alexandria City, VA (12.9).
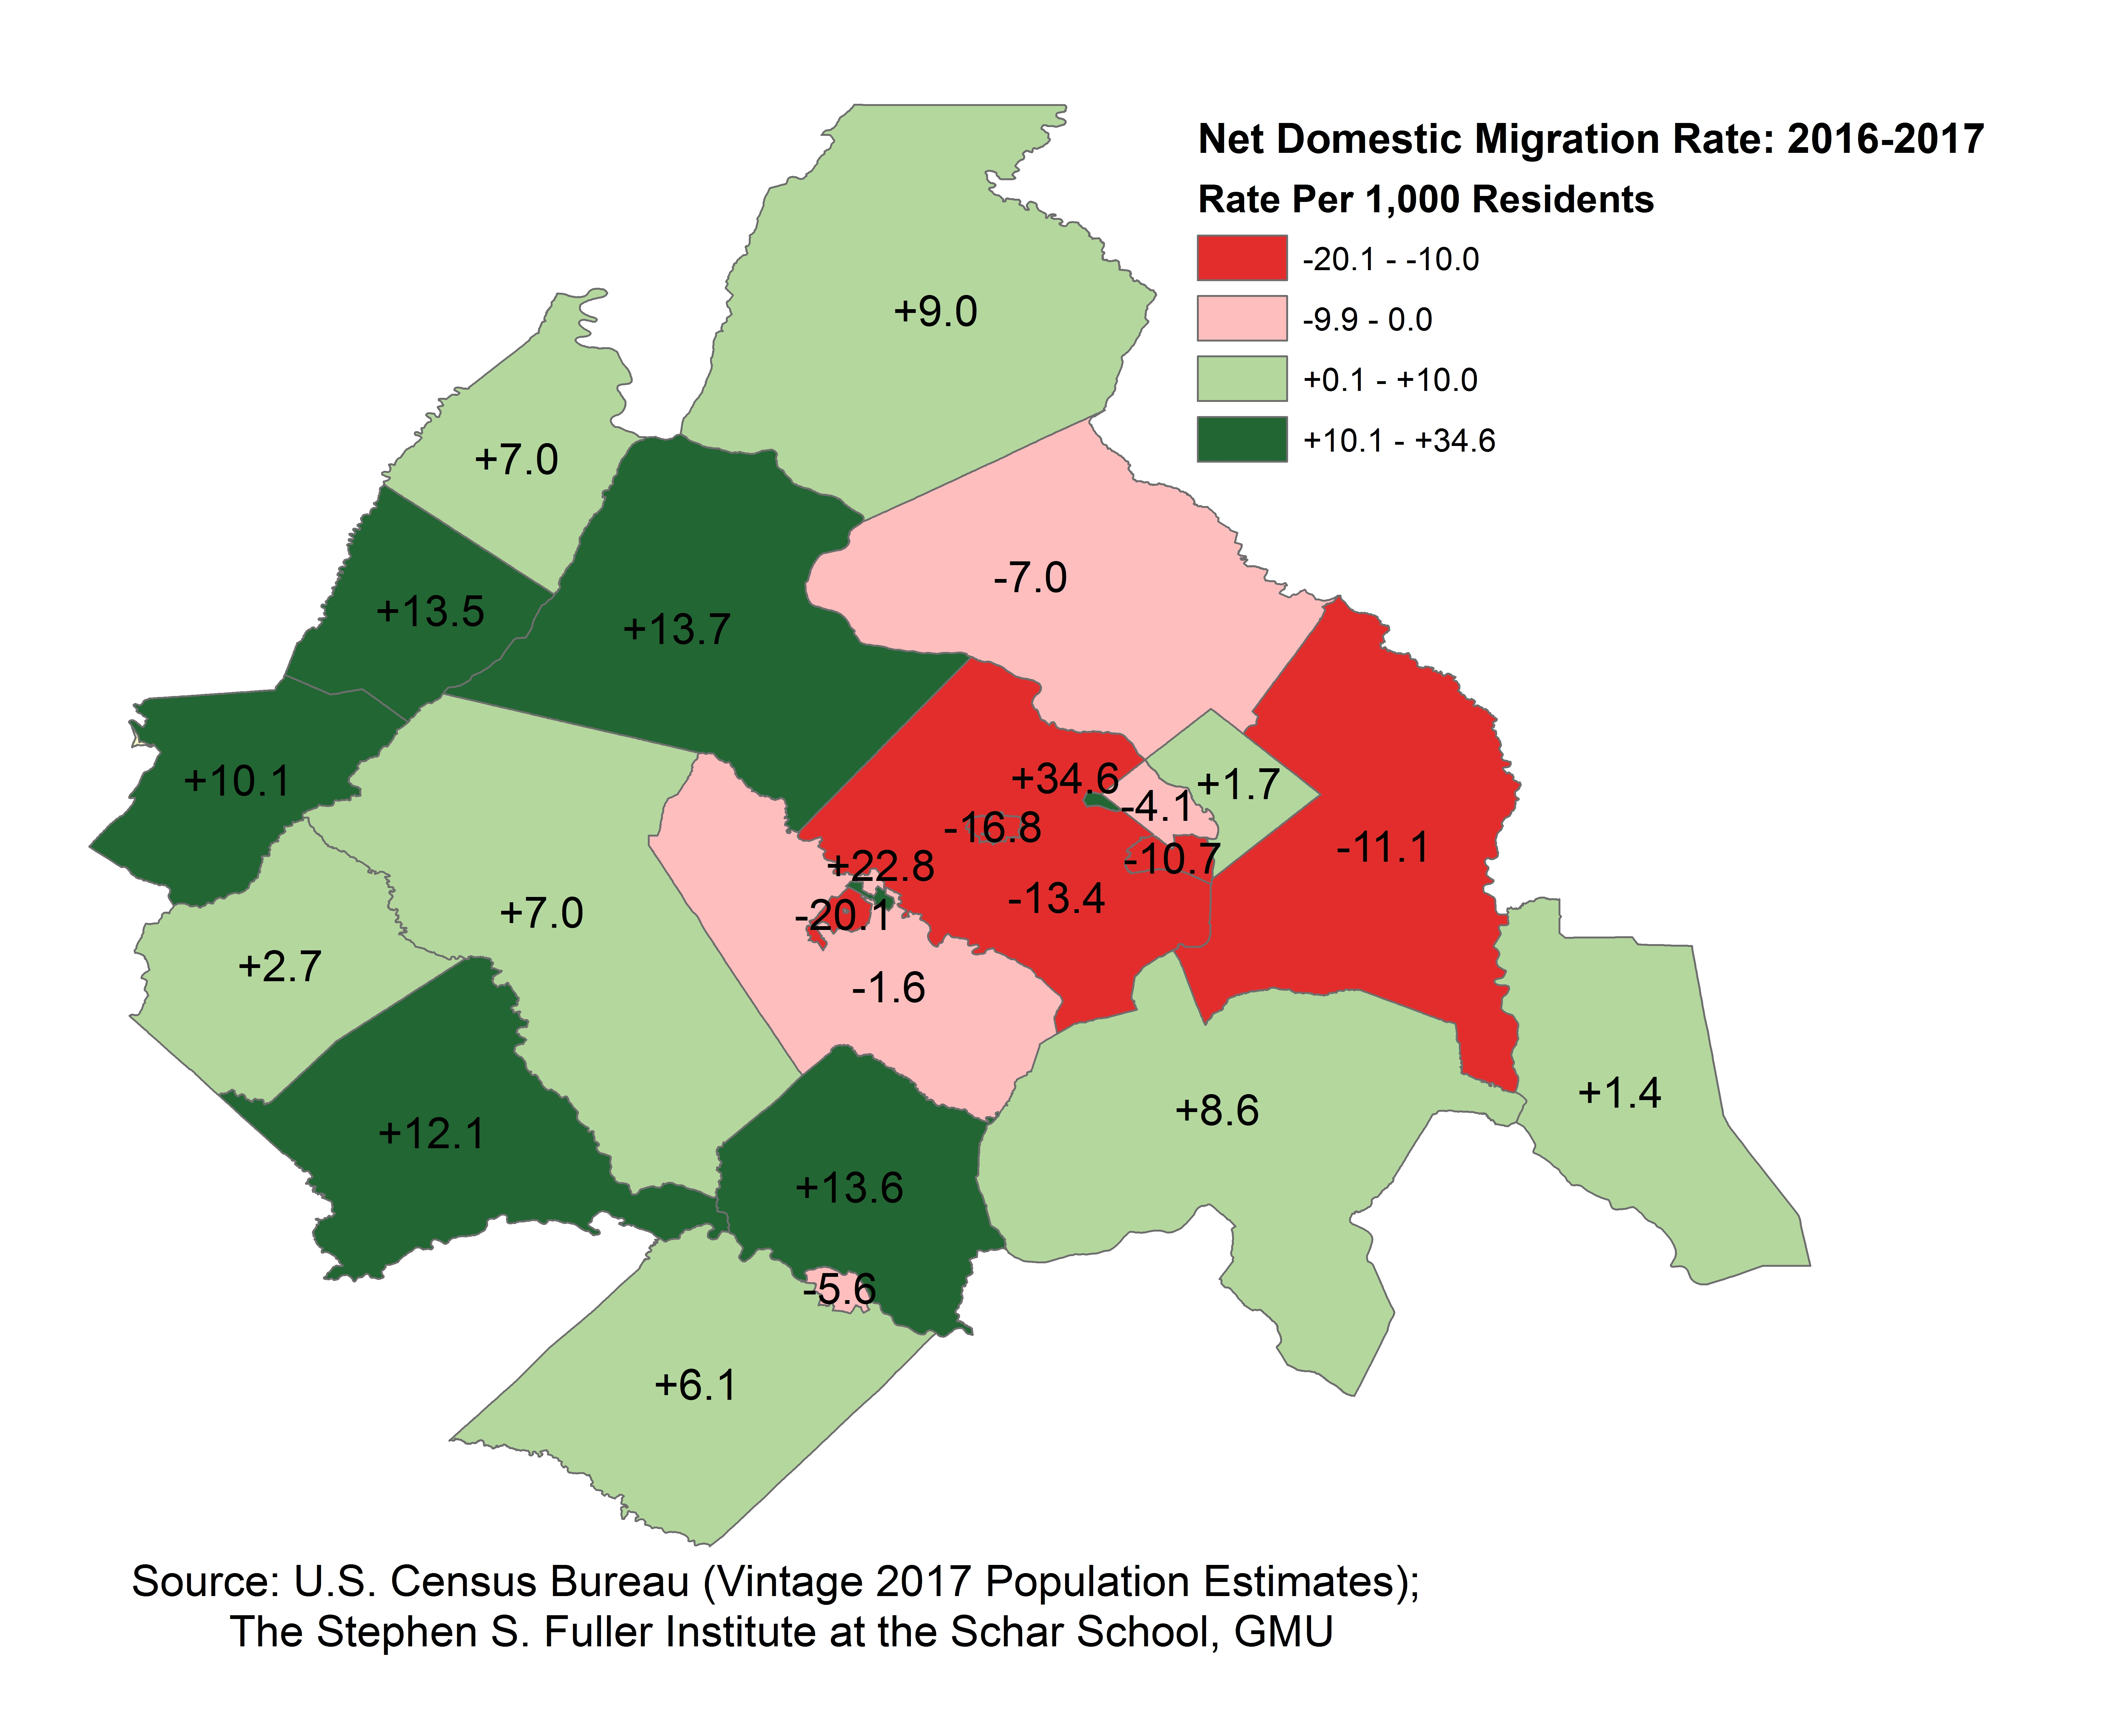
Net domestic migration was negative for nine of the 24 jurisdictions in the Washington region. The largest absolute loss occurred in Fairfax County, which had 15,350 more residents move to other parts of the region or the U.S. than move in. The largest absolute gained was in Loudoun County, which added 5,390 residents as a result of net domestic migration. After normalizing for population size, the largest losses were in Manassas City, VA, Fairfax City, VA and Fairfax County, VA. The largest relative gains were in Falls Church City, VA, Manassas Park City, VA, and Loudoun County, VA.
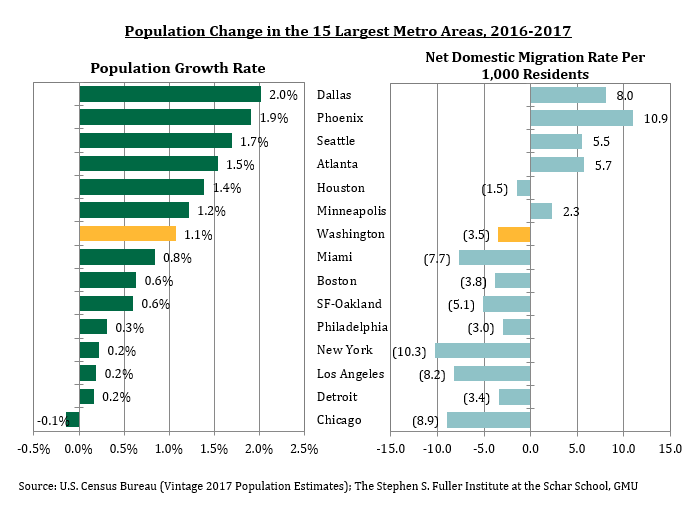
Population Change in the 15 Largest Metro Areas
The Washington region had the seventh largest percentage population growth rate of the 15 largest metros[2] in 2017. The region ranked eighth from 2014 through 2016, fifth in 2013, fourth in 2012 and second in 2011.
In 2017, Dallas led the metros for population growth, rising 2.0 percent and by 146,240 residents. Only one metro had population declines and the number of residents in Chicago fell by 13,290 (-0.1%); Chicago’s population has now decreased for three consecutive years. By contrast, the population in the Detroit metro has increased since 2015 and increased 0.2 percent (7,130 people) in 2017.
Similar to the pattern in prior years, net domestic migration was positive for the four metros with the fastest population growth in 2017. Conversely, metros with higher rates of net domestic out-migration had comparatively weak overall population growth rates.
About These Data
Data are from the Vintage 2017 Population Estimates from the U.S. Census, released March 22, 2018. Estimates are as of July 1 for every year. The jobs data are from the U.S. Bureau of Labor Statistics as of March 12, 2018. The 2013 metro region delineations are used throughout for all metros and all years. Note that these data do not include any information on demographics.
[1] This trend reflects a revision to last year’s data.
[2] Measured by Gross Regional Product.