
The Washington region’s job growth in 2019 continues to be subdued and the average gain in the first four months was 28,200, 20.0 percent smaller than the gain in 2018. Job growth in the region has also been increasingly concentrated both by sector and geography, a trend that extends back to the 2014. The Professional & Business Services and Leisure & Hospitality sectors accounted for nearly all (99.9%) of the average growth in the first four months of 2019. Similarly, job growth has been disproportionately concentrated in Northern Virginia, which captured 91.3 percent of the year-to-date gains.
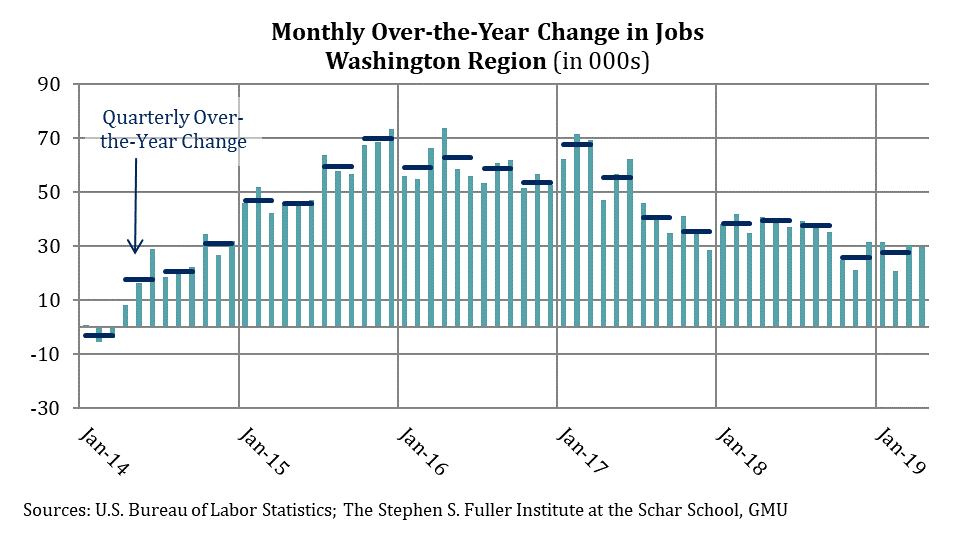
The Washington region added 29,800 jobs between April 2018 and April 2019 and 30,600 jobs in the 12 months ending in March 2019. While the monthly over-the-year gains in March in April were stronger compared to the performance in February, job growth was weak compared to prior four years and extends the slowing trend that began in early 2017.
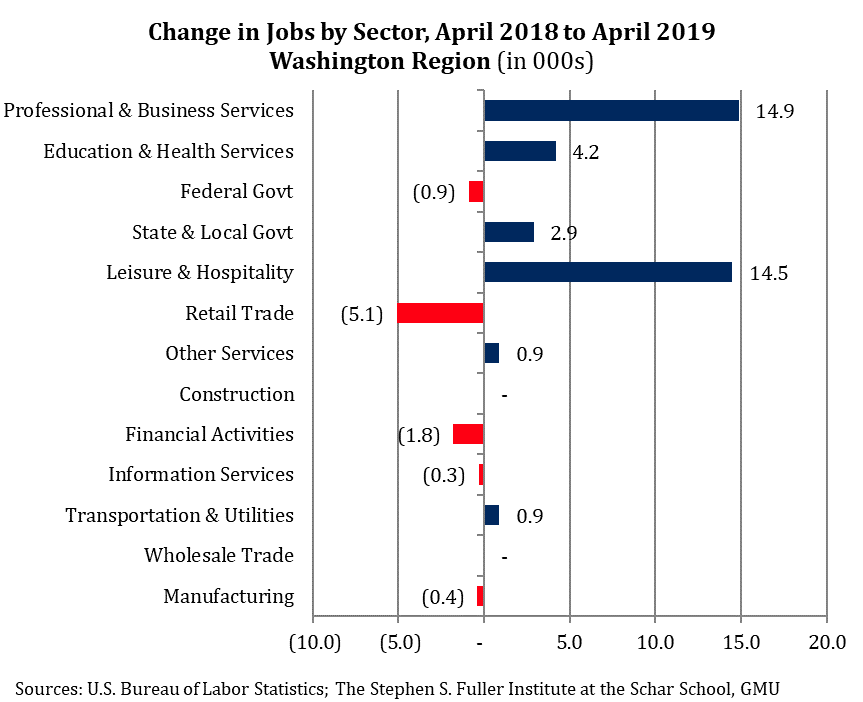
Job growth has been dominated by two sectors in 2019: Professional & Business Services and Leisure & Hospitality. In April, these sectors added 29,400 jobs, accounting for 98.7 percent of all growth, consistent with the trend in prior months. Modest increases in Education & Health Services (+4,200) and State & Local Government (+2,900) were offset by losses in Retail Trade (-5,100) and Financial Activities (-1,800). No other sector had gains or losses of more than 1,000 jobs.
Changing Geography of Job Growth in the Washington Region
Job growth in 2019 has been concentrated in Northern Virginia and marks an acceleration of a trend that has existed since 1990 but became more pronounced after Sequestration. The increasing concentration of jobs in Northern Virginia has primarily been at the expense of Suburban Maryland, which has lost share. The District’s share of the region’s jobs decreased in the 1990s, as the result of absolute job losses, but has been relatively stable since.
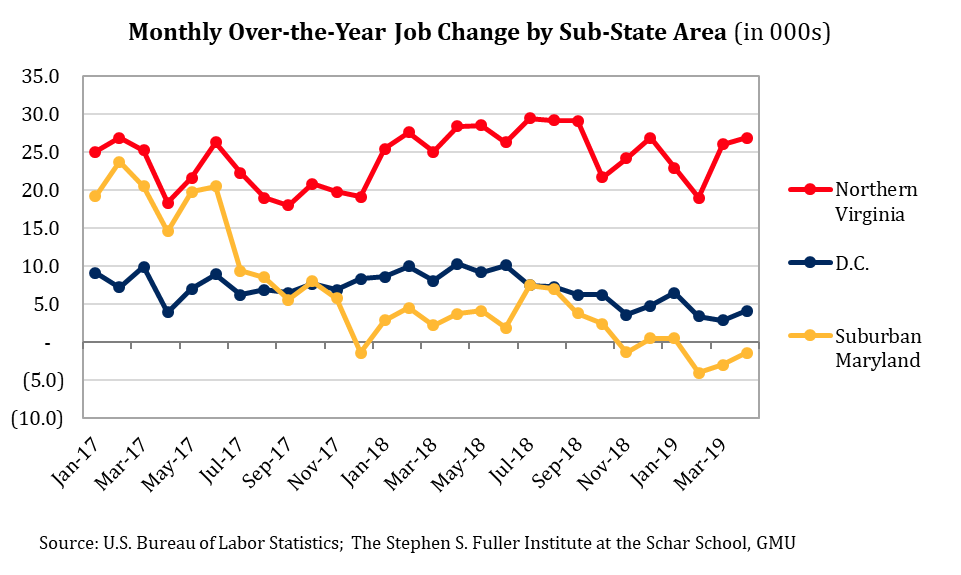
In April 2019, Northern Virginia added 26,900 jobs compared to April 2018 and accounted for 90.9 percent of the total net gain in region. The April gain was modestly stronger than the average gain in 2019 so far of 23,700. While this year-to-date performance is 11.8 percent below the gain in 2018, Northern Virginia has had the smallest deceleration in growth of the sub-state areas in 2019.
The District added 4,100 jobs in April on a monthly over-the-year basis, accounting for 13.9 percent of the net gain in the region. The average growth in the first four months of 2019 was 4,200, slightly more than one-half the growth that occurred in 2018 (+7,700).
Suburban Maryland had the sharpest deceleration in job growth of the three sub-state areas. In April 2019, Suburban Maryland had 1,400 fewer jobs compared to April 2018. On average in 2019, Suburban Maryland lost 2,000 jobs on a monthly over-the-year basis; in 2018, the sub-state area added 3,200 jobs.
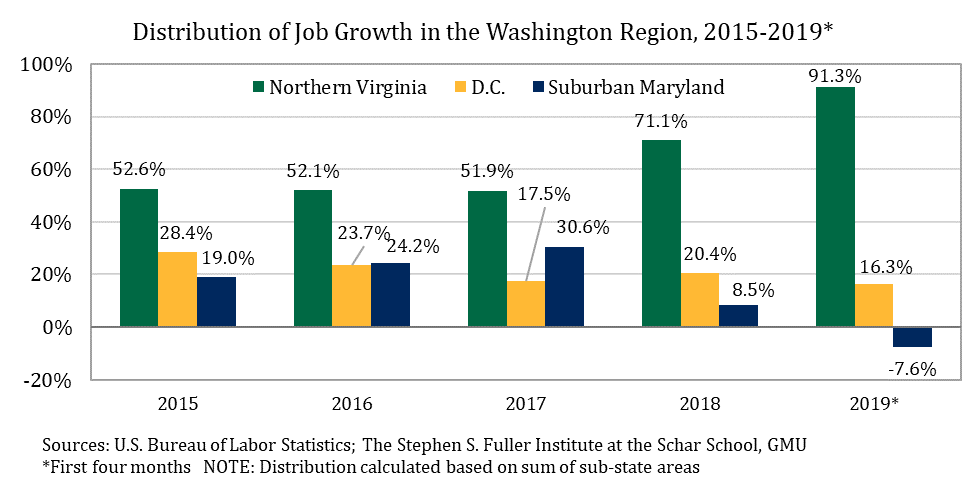
Since 2014, job growth in the Washington region has been increasingly concentrated in Northern Virginia. In 2014, 44.5 percent of all jobs in the region were located in Northern Virginia. Since 2014, Northern Virginia has consistently captured a larger share of the job growth than its base, a pattern that accelerated in 2018 and into 2019. So far in 2019, 91.3 percent of the region’s net job growth has occurred in Northern Virginia.
In contrast, job growth has been less concentrated in Suburban Maryland since 2014. Between 2014 and 2017, Suburban Maryland captured 24.1 percent of the job gains in the region despite accounting for 31.3 percent of the jobs base in 2014. This relative underperformance worsened in 2018 and into 2019. During the first four months of 2019, Suburban Maryland accounted for 30.5 percent of the region’s jobs base.
The share of the region’s job growth captured by the District since 2014 has been relatively stable, although it softened in the first four months of 2019. In 2014, D.C. had 24.14 percent of all jobs and between 2014 and 2018 it captured 23.0 percent of job growth, modestly underperforming relative to its base. So far in 2019, the District has accounted for 16.3 percent of the job growth in the region, falling to 24.11 percent of the jobs base.
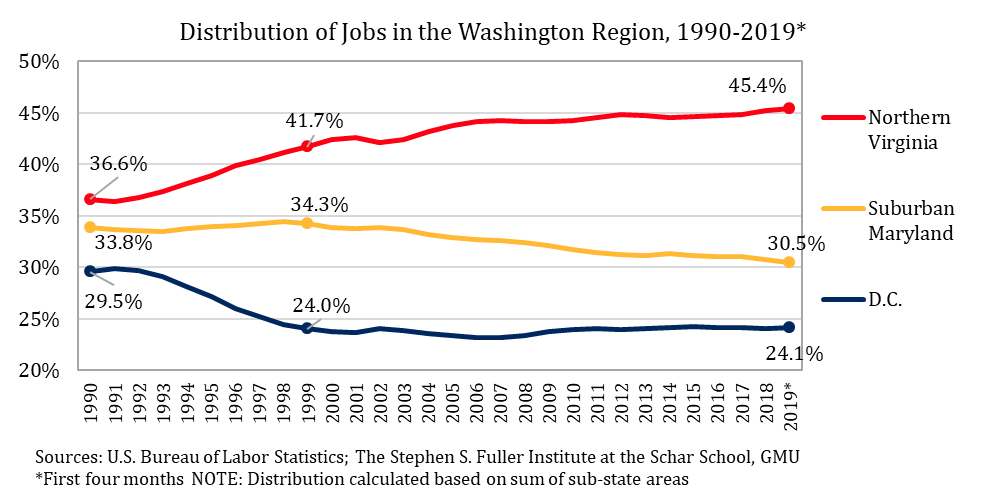
Overall, the recent geographic distribution of job growth in the Washington region has been the norm since 1999, when the District’s absolute job losses ceased. Since then, the share of the region’s jobs located in the District has fluctuated only modestly, ranging from a low of 23.1 percent in 2007 to a high of 24.2 percent in 2015. Suburban Maryland has had consistent declines, falling from being the location of 34.3 percent of the region’s jobs in 1999 to an average of 30.5 percent in the first four months of 2019. Similarly, Northern Virginia has consistently grown its share, rising from 41.7 percent in 1999 to an average of 45.4 percent in the first four months of 2019.
Recent job growth in the Washington region has been limited to two sectors and one sub-state area. Overall, two-thirds (67.5%) of all gains occurred in the Professional & Business Services and Leisure & Hospitality sectors in Northern Virginia so far in 2019. Consistent slowdown in growth suggested by the Washington Leading Index, it is likely that the region’s economic activity will continue to be more concentrated in the near-term.
About These Data
All data are from the U.S. Bureau of Labor Statistics (Current Employment Statistics State & Local Area, Not Seasonally Adjusted) released May 17, 2019, not seasonally adjusted. The sum of the sub-state areas is used to calculate the distribution of jobs.