
Download Full Report as a PDF>>
The onset of the pandemic resulted in the unprecedented loss of nearly 400 thousand jobs in the Washington region in less than 60 days. After a long recovery, the Washington region recovered to its pre-pandemic jobs level, recording 3,357,100 jobs in November 2022, 4,600 more jobs than in February, 2020. Despite the Washington region having recovered total job counts, the distribution of the recovery has varied among sub-regions. This report documents job growth in the Washington region by sub-region and sector on the long road to recovery.
Jobs Recovery in the Washington Region
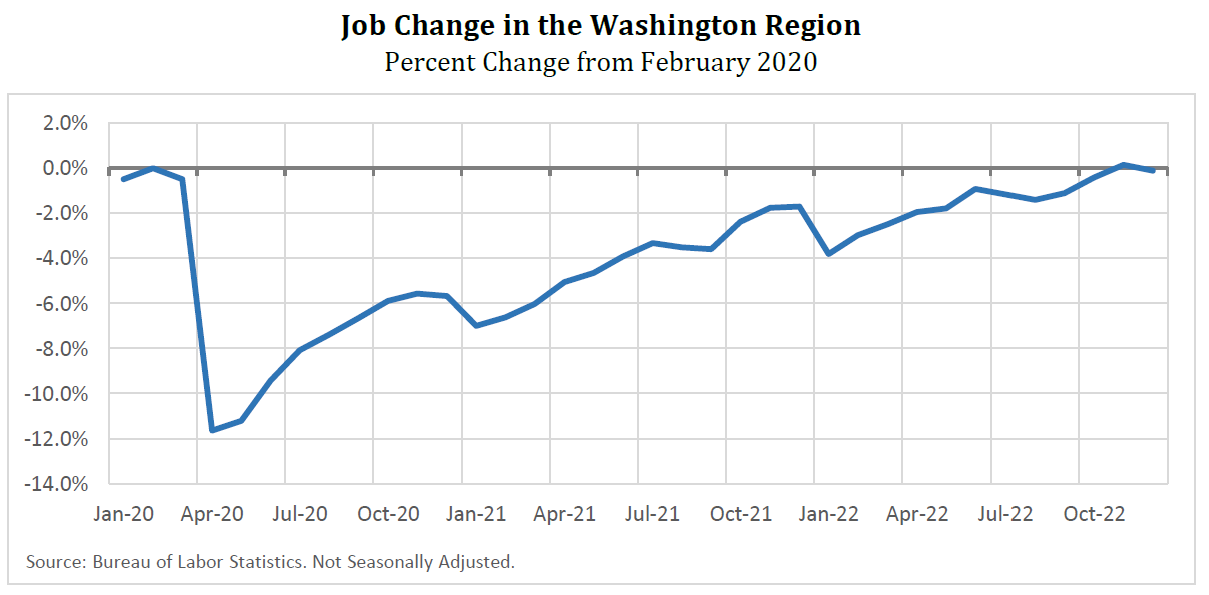
In February 2020, the Washington region logged 3.353 million jobs. While November of 2019 remains the record number of jobs in the region (3.39 million), February 2020 marks the last month before the coronavirus widely impacted the US and is used here to demarcate the pandemic. The arrival of the coronavirus had immediate and devastating impacts on businesses and residents. From February to March, the region lost 16,800 jobs before shedding another 373,300 jobs in April to a low of 2.96 million jobs. After the disruption, however, the region began to adjust. Businesses adapted to social distancing and consumers expanded e-commerce spending, which sparked a rapid partial job recovery. The recovery has been on-going despite winter surges in COVID-19 case counts causing temporary job losses. After 34 months the Washington region recorded 3.357 million jobs in November 2022, 4,600 more than in February 2020.
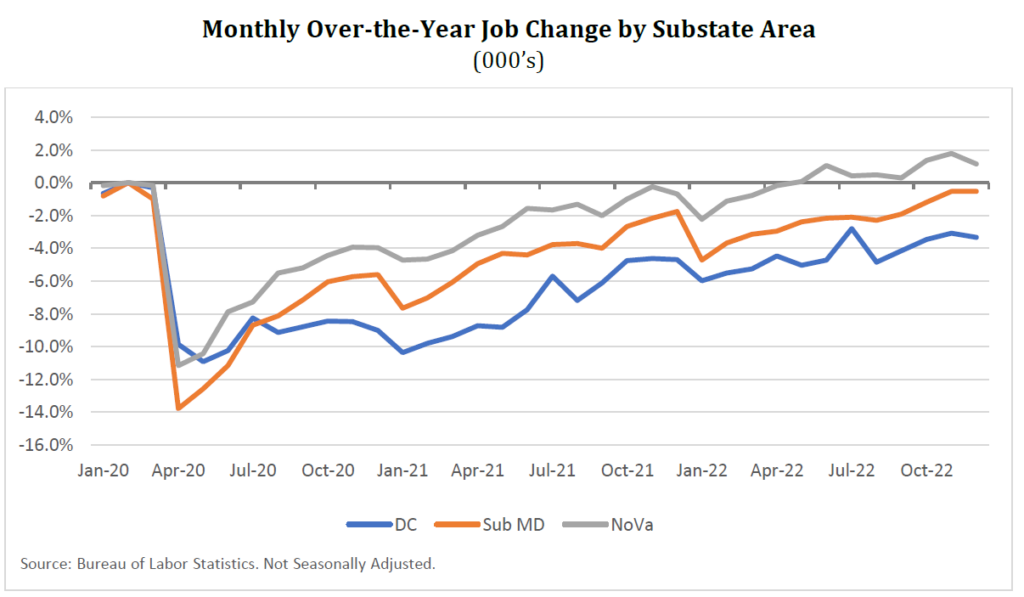
The Washington region has recovered the number of pre-pandemic level jobs due to stronger job growth in Northern Virginia, with Suburban Maryland and DC still below the pre-pandemic number of jobs. The number of jobs in Northern Virginia decreased from a record 1.52 million in February 2020 to 1.35 million in April 2020. After the April low, businesses in Northern Virginia steadily added jobs, nearly recovering lost jobs by November 2021, prior to the emergence of the Omicron variant and subsequent job losses. Despite the setback, Northern Virginia recovered to the pre-pandemic number of jobs in May 2022 and was 1.1% above the February 2020 level in December 2022.
In contrast with Northern Virginia, Suburban Maryland and DC have yet to recover to the number of jobs in February 2020. In Suburban Maryland, the number of jobs declined 13.8% from a near-record number 1.02 million jobs in February 2020 to 875,600 jobs in April. While job growth in Suburban Maryland steadily increased following the initial shock of the pandemic, job declines associated with increased number of Covid-19 cases were more severe than in Northern Virginia. The month-over-month declines in January 2021 and January 2022 were approximately twice as large in Suburban Maryland than in Northern Virginia. Suburban Maryland remained 0.5% below pre-pandemic levels in December 2022. Despite registering a similar initial share of jobs lost at the outset of the pandemic as Northern Virginia and Suburban Maryland, the number of jobs in DC remained 3.3% below pre-pandemic levels in December 2022. This appears primarily due to the fact that the number of jobs in DC only began to increase meaningfully in January 2021.
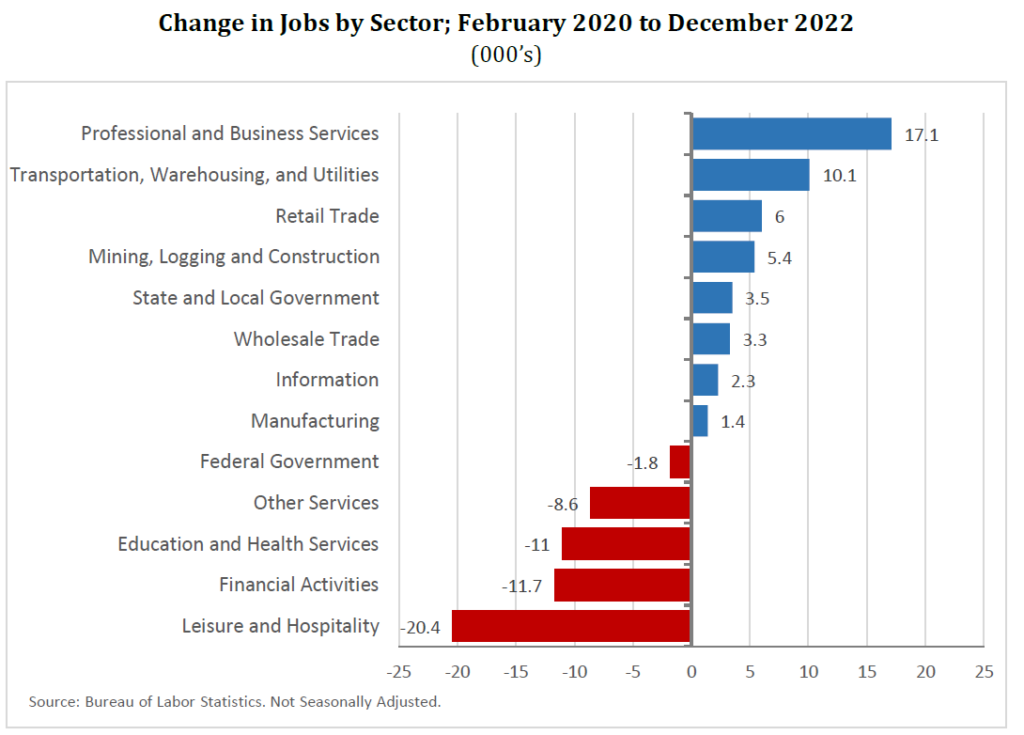
In addition to geographic variation, the jobs recovery has varied notably across key sectors of the Washington region’s economy. From February 2020 to December 2022, the professional and business services sector (+17.1k) and the transportation, warehousing, and utilities sector (+10.1k) have added the greatest number of jobs. While the professional and business services sector added the most jobs, the additional 17,100 jobs only represented a 2.2% increase from February 2020, as the sector is the largest by payroll jobsin the region. In comparison, the 10,100 jobs added in the transportation, warehousing, and utilities sector represented a 13.3% increase from February 2020. In contrast, the leisure and hospital sector (-20.4k) and financial services sector (-11.7k) were still well below the February 2020 levels in December 2022.
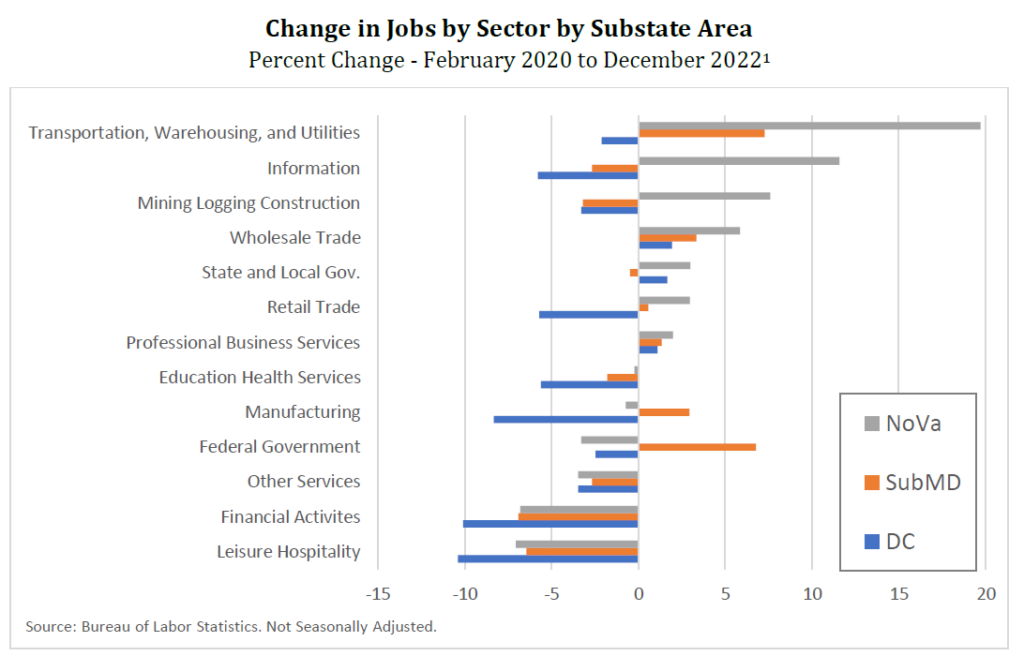
Comparing percent growth among sectors in the three sub-regions reveals that DC is lagging broadly[1]. The number of jobs in DC remains below pre-pandemic levels in ten of thirteen sectors of the economy. Furthermore, in the three sectors with job growth since the start of the pandemic, DC is third among the sub-regions in two of the three sectors, being only second in growth of State and Local government jobs. Despite DC lagging the other sub-regions, all sub-regions have fewer jobs in the financial activity, the leisure and hospitality sector, and other services than before the pandemic.
Conclusion
Nearly three years after the Washington region shed 390,100 jobs in the wake of the pandemic, the region recovered to its pre-pandemic number of jobs. While the overall number of jobs may have recovered, the recovery has been uneven among sub-regions and sectors. Northern Virginia leads the region, having recovered to its pre-pandemic job levels in May 2022. Suburban Maryland and DC still both have fewer jobs than before the pandemic, due to larger losses associated with increased coronavirus cases in winter months and a much later recovery start, respectively. In terms of sector recovery, although the professional and business services sector added the greatest number of jobs from February 2020 to December 2022 (+17.1k), the transportation, warehousing, and utilities sector has added the most in percentage terms (+13.3%). Among sub-regions, DC is underperforming broadly, having only three sectors with more jobs in December 2022 than at the outset of the pandemic. While the region may have fully recovered the number of jobs, the distribution of where jobs are and what sectors jobs are in has changed course notably compared against pre-pandemic trends.
About These Data
The data are from the Current Employment Statistics (CES) program of the US Bureau of Labor Statistics (BLS). The CES program is a monthly survey that produces information based on payroll records. In this post, employment data from the CES program are used. Employment data capture data on the number of people who received pay in the pay-period that included the 12th of the month. Employment is categorized by the “place of work” rather than their “place of residence”. A person who is on more than one payroll is counted on each payroll. That is, a person who has two payroll jobs is counted twice. For this reason, employment is referred to in this post as either “jobs” or “payroll jobs”.
[1] Sectors are sorted according to percent change from February 2020 to December 2022 in the Northern Virginia sub-region. Northern Virginia was chosen as it is the sub-region with the greatest number of jobs.