Download Full Report as a PDF>>
Per capita personal income (PCPI) is a common measure for comparing economic performance across Metropolitan Statistical Areas (MSAs). While rising PCPI can be an indicator of economic growth, as a measure of economic well-being (economic development), income levels need to be considered within the context of the cost of living. The Bureau of Economic Analysis collects and disseminates data on real PCPI, which is PCPI adjusted for local cost of living, as measured by regional price parities (RPPs). Given that the Washington region has one of the highest costs of living in the U.S., the real PCPI in the Washington region ranked 6th in 2021, a spot below the unadjusted PCPI rank. From 2008 to 2021, the Washington region underperformed against nearly every other top 15 metro area in real PCPI growth. The Washington region’s cost of housing is the underlying RPP component contributing the most to the high cost of living.
Per Capita Personal Income – Adjusted vs Unadjusted
In 2021, the Washington region’s PCPI was $80,822. Among the top 15 largest metropolitan areas by population, the Washington region’s PCPI ranked 5th. Adjusting for regional prices, real PCPI in the DC region in 2021 was $72,870, ranking 6th among the top 15 largest metro areas. In contrast, the Philadelphia region’s unadjusted PCPI was $72,379 in 2021, ranking 8th. However, due to lower regional prices than the national average, real PCPI in the Philadelphia region was $ $73,237 in 2021, ranking 5th, ahead of the Washington region.
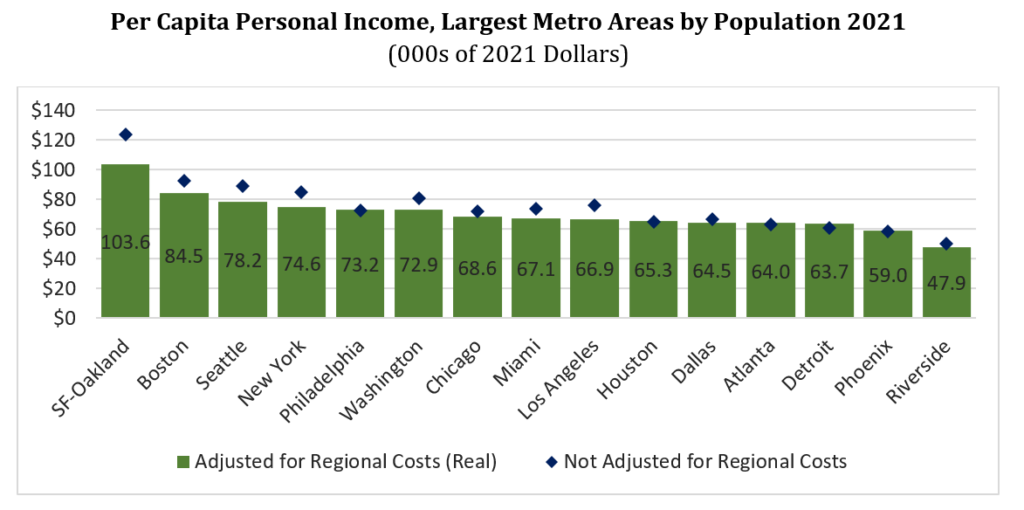
Following the Great Recession of 2008, real PCPI of all of the top 15 metros declined. Real PCPI in the Washington region declined 2.4% from 2008 to 2009, with only two other regions recording smaller declines, Boston and Atlanta. Despite avoiding the worst consequences of the Great Recession, however, the Washington region underperformed nearly all top 15 from 2009 through 2021. In 2013, the real PCPI in the Washington region remained 1.4% lower than in 2008, ranking 13th in growth. In 2014, the region slipped to 15th in real PCPI growth from 2008. From 2017 thought 2021, the Washington region’s real PCPI growth from 2008 ranked 14th, ahead of only Houston. In 2021, the Washington region’s real PCPI was only 16.8% greater than in 2008, far below 1st ranked SF-Oakland with a real PCPI 58.4% higher in 2021 than 2008.

To adjust PCPI to real levels, RPPs are used. RPPs measure price level variation among metro areas and indicate the percent difference from overall national price levels. In 2021, price levels in the Washington regions were 11.3 percent greater than the overall national price level. Among the top 15 metro areas, the Washington region’s price levels ranked 5th. The first ranked MSA in 2021 was SF-Oakland, where price levels were 19.8 percent greater than the national level. Five MSAs had price levels lower than the overall nation: Houston, Philadelphia, Phoenix, Atlanta, and Detroit. While the Washington region was ranked 5th in 2021, it was ranked 6th in 2019 and 2020, implying the region has gotten more expensive relative to its peers. However, the Washington region had the highest regional prices in 2013 and 2014.

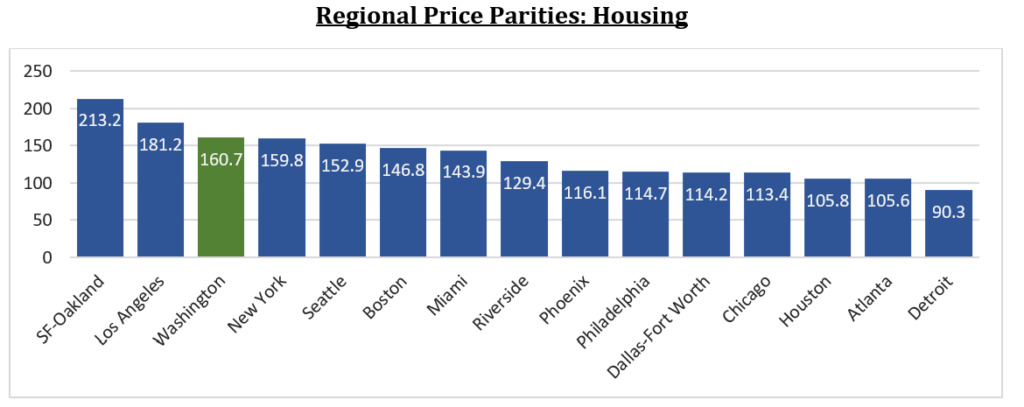
Among underlying components, the housing RPP in the Washington region is notably more expensive than prices overall (See the appendix for all components). Housing in the Washington region is 60.7 percent greater than the overall national housing price level. Housing prices in the Washington region in 2021 were the third highest among large metros, behind only SF-Oakland and Los Angeles. Overall, housing prices in the Washington region are the greatest contributing factor to higher total price levels. Given empirical evidence supporting the theory that high housing costs negatively impact employment growth[1],[2], high housing costs in the Washington region are likely negatively impacting the region’s competitiveness in attracting and retaining employees.
Conclusion
While the Washington region has a high PCPI, it also has a high cost of living. While the Washington region is ranked 5th in PCPI among the 15 largest MSAs population, the Washington region’s real PCPI is ranked 6th, due to high regional prices. The Washington region’s real PCPI growth has also underperformed over the past 15 years, real-PCPI growth from 2008 through 2021 in the Washington region was below every MSA except for Houston over the period. Despite price levels of all components being greater than overall national price levels, the price of housing in the region is the greatest contributor to the high cost of living in the Washington region. Housing prices in the Washington region in 2021 were 60.7 percent greater than housing prices in the overall nation, behind only San Francisco-Oakland and Los Angeles. Given empirical evidence supporting the theory that high housing costs depress employment growth, high housing costs likely make the Washington region less competitive relative to peers.
About These Data
Data are from the Bureau of Economic Analysis (BEA). Per capita personal income is from the November 16th, 2022 release. Real per capita personal income and regional price parity data are from the December 15th, 2022 release. Real per capita personal income are 2012 dollars converted to 2021 dollars using the PCE index revised on December 22nd, 2022. Regional price parities are referred to as price levels.
Appendix
2021 RPPs:
| Metro | Goods | Services: Housing | Services: Other | Services: Utilities | All items |
| SF-Oakland | 113.4 | 213.2 | 108.2 | 167.5 | 119.8 |
| New York | 104.4 | 159.8 | 110.8 | 130.0 | 114.6 |
| Seattle | 114.9 | 152.9 | 106.1 | 94.5 | 114.6 |
| Los Angeles | 108.8 | 181.2 | 102.5 | 131.2 | 113.8 |
| Washington | 108.8 | 160.7 | 102.7 | 107.8 | 111.3 |
| Miami | 105.3 | 143.9 | 103.8 | 96.8 | 109.9 |
| Boston | 109.4 | 146.8 | 101.2 | 156.5 | 109.7 |
| Riverside | 100.4 | 129.4 | 100.8 | 151.3 | 105.5 |
| Chicago | 106.6 | 113.4 | 103.8 | 82.9 | 105.4 |
| Dallas-Fort Worth | 102.7 | 114.2 | 103.1 | 84.8 | 103.9 |
| Houston | 98.4 | 105.8 | 99.7 | 88.9 | 99.7 |
| Philadelphia | 94.2 | 114.7 | 98.8 | 101.0 | 99.2 |
| Phoenix | 94.8 | 116.1 | 98.4 | 89.7 | 99.2 |
| Atlanta | 97.2 | 105.6 | 98.7 | 99.8 | 99.1 |
| Detroit | 94.5 | 90.3 | 98.8 | 101.4 | 96.1 |
[1] Chakrabarti, Ritashree, and Junfu Zhang. “Unaffordable housing and local employment growth: Evidence from California municipalities.” Urban Studies 52.6 (2015): 1134-1151.
[2] Wassmer, Robert W. “Do Higher Land Costs for New Single-Family Housing Inhibit Economic Activity in US Metropolitan Areas?.” Economic Development Quarterly 35.4 (2021): 325-337.