
Download the “Washington Region Labor Force Stagnation” report as a PDF>>
The pandemic impacted the Washington region’s economy more negatively than any previous shock over the past 30 years. The region’s labor force, the number of people employed or looking for work, increased steadily from 1990 to 2020. In the wake of the pandemic, however, the labor force contracted initially by over 227,000 workers and remains down 167,000 two years later. The worker shortage in the Washington region is more acute than the nation as a whole as well as peer metro areas. This shortage of workers in being felt by all sectors of the economy and has perhaps reached a point where the tight labor market is constraining economic growth in the region.
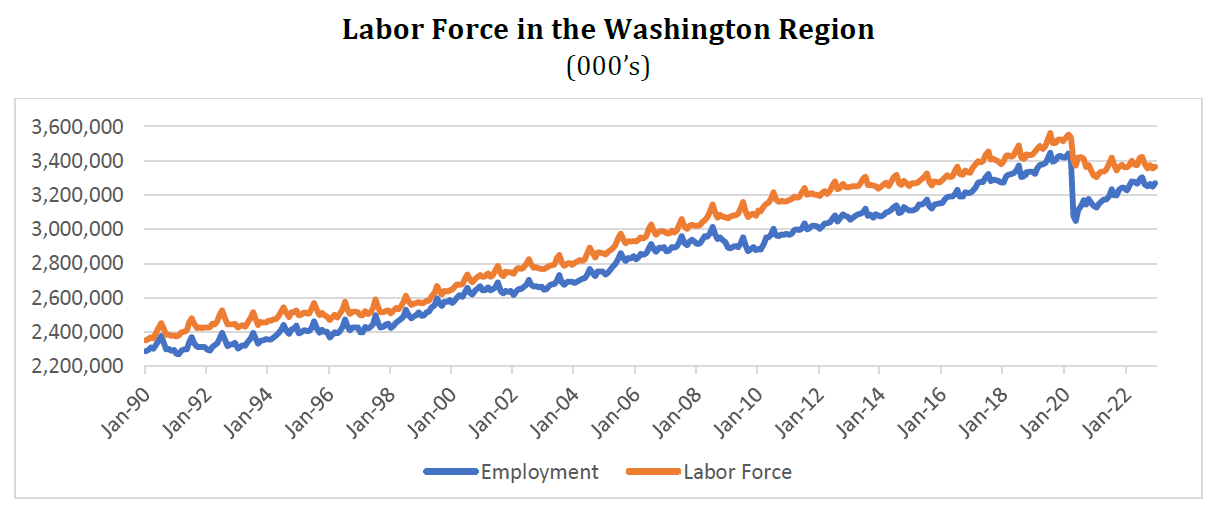
For the first time in 30 years, the Washington region’s labor force declined two years in a row (2021 and 2022). From 1990 to February 2020, the region’s labor force grew from 2.3 million to 3.6 million. The COVID-19 pandemic sparked a drop in labor force participation that saw total labor force counts bottoming out at 3.1 million in January 2021. While the region’s labor force increased to 3.4 million by June 2021, it has stagnated since. Meanwhile, the number of people employed in the Washington region increased steadily following the initial shock from the pandemic. In January 2020, there were 3.4 million people employed in the Washington region. After employment declined 300,000 year-over-year in April 2020, the number of employed increased to a post-pandemic high of 3.3 million in July 2022 before declining 1% through December 2022. The rising number of employed simultaneously with a stagnant labor force indicates there are fewer unemployed individuals looking for jobs resulting in historically low unemployment rates for the region (See appendix).
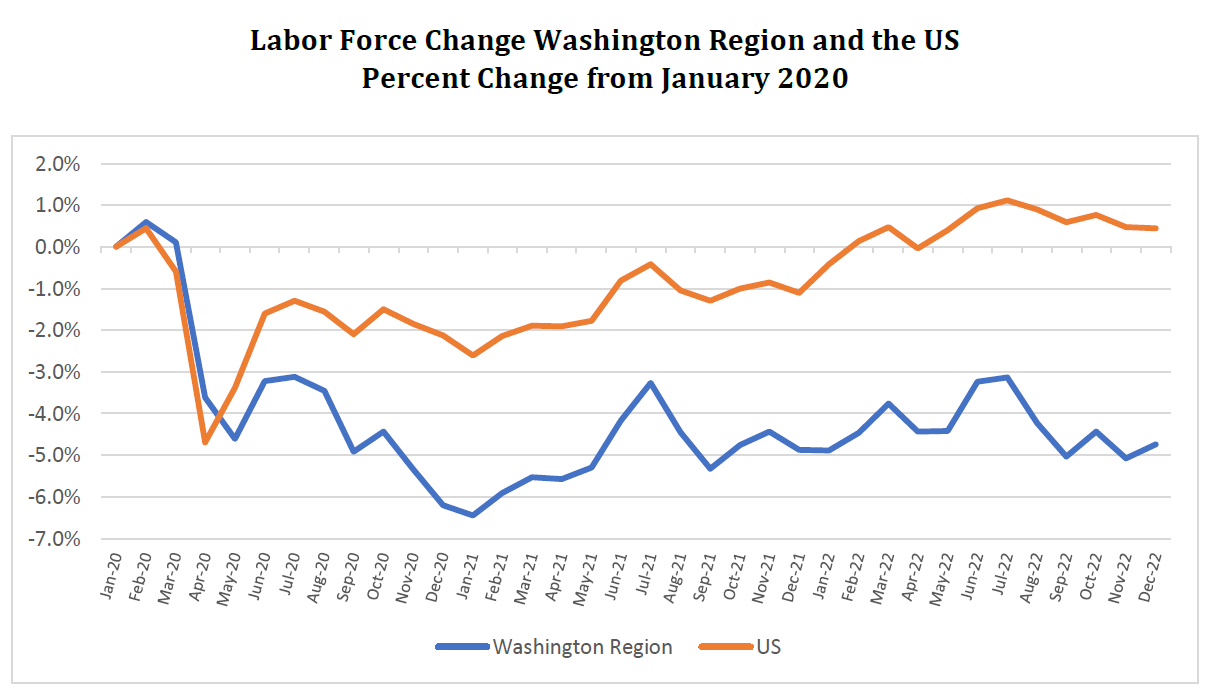
Following the onset of the pandemic, the labor force in the Washington region declined by approximately the same proportion as the national average. National data, derived from surveying approximately 60,000 households each month, reveal that the initial decline in the US labor force overall was 4.7 percent. Similarly, the Washington region’s labor force initial decline was 4.6 percent, one month after the national decline. Following the initial decline, however, the US labor force slowly began to grow, regaining the pre-pandemic level recorded in January 2020 in February 2022. In contrast, the labor force in the Washington region declined further through January 2021. In January 2021, the labor force in the Washington region was 6.4 percent smaller than it was in January 2020. In December 2022, the Washington region’s labor force remained 4.7 percent smaller than in January 2020 while the US labor force was 0.4 percent larger over the same period. The fact that the Washington region’s labor force has not recovered is likely due to a variety of factors, including the high local cost of living.
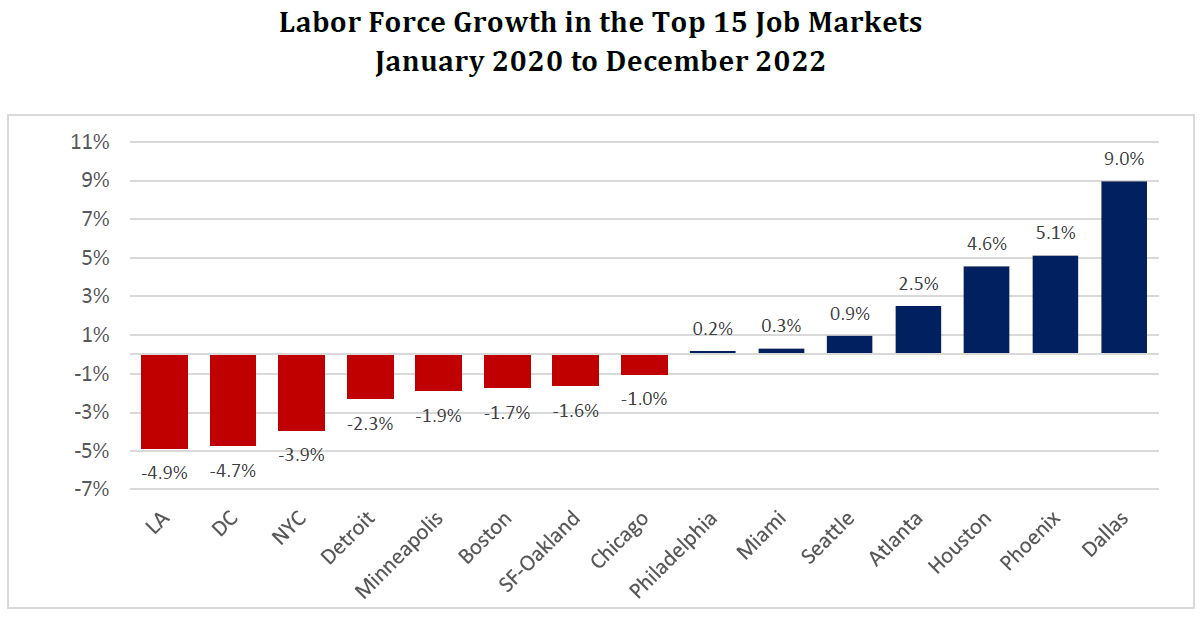
Comparing the post-pandemic labor force growth of the Washington region to the top 15 metro areas by the number of jobs reveals that the Washington region is underperforming every metro area except Los Angeles. The Washington region’s labor force declined 4.7 percent from January 2020 to December 2022. The only metro area that recorded a larger percent decline was Los Angeles, whose labor force contracted by 4.9 percent. New York also recorded a notable labor force contraction of 3.9 percent. Not all major metro areas, however, recorded labor force declines. The labor force in the Dallas region gained 9.0 percent, or 356,140 people, from January 2020 to December 2022.
Conclusion
The labor force in the Washington region contracted during the pandemic and has not recovered. Furthermore, the Washington region has underperformed all of the 15 largest job markets in the country with the exception of Los Angeles. While the unemployment rate is near all time lows, the tight labor market is partially the result of a smaller labor market. The lack of available workers is likely constraining business growth in the region and if left unaddressed, the region will eventually see employers shifting business operations to regions with a more robust supply of workers.
About These Data All data are from the Bureau of Labor Statistics (BEA). The report uses two sources, the Current Population Survey (CPS) and the Local Area Unemployment Statistics (LAUS). The CPS program from the BLS provides monthly estimates of the labor force, employment, and unemployment for the US as a whole by surveying approximately 60,000 households per month. The civilian labor force includes all non-institutional persons 16 years or older that are either employed or unemployed. Employed are those that worked for pay, in their own business or the business of a family member, or were temporarily absent from work the week that includes the 12th of each month. Unemployed are those that were not employed but were trying to find work. Data used were released February 3rd, 2023. The LAUS program from the BLS provides the labor force, employment, and unemployment estimates for sub-regions of the US, including Metropolitan Statistical Areas (MSAs) and is derived from CPS and Current Employment Statistics (CES) estimates. The CES program produces employment, hours, and earning statistics by industry for workers on payrolls by surveying more than 130,000 businesses and government agencies. LAUS data were extracted March 1st, 2023. The BLS uses the February 28, 2013 definition of MSAs produced by the Office of Management and Budget (OMB).