Download Full Report as a PDF>>
The cost of housing in the Washington region has long been recognized as a challenge for attracting and retaining talented young workers to the region. This challenge is becoming critical in a post-pandemic, hybrid-work labor market. Even with mortgage interest rates running almost 400 basis points higher than just 18 months ago, the demand for housing in our region remains robust – if a bit lower than peak-pandemic levels. This suggests that boosting housing supply may be the only way to effectively hold down the rising cost of homeownership in the DC Metro area.[i],[ii] In this article, we examine the history of housing construction permits in the Washington region from 1995 through 2022 to examine how well we are doing in creating new housing supply. Additionally, we examine how the mix of housing permits issued has changed over the past 27 years.
Housing Permits
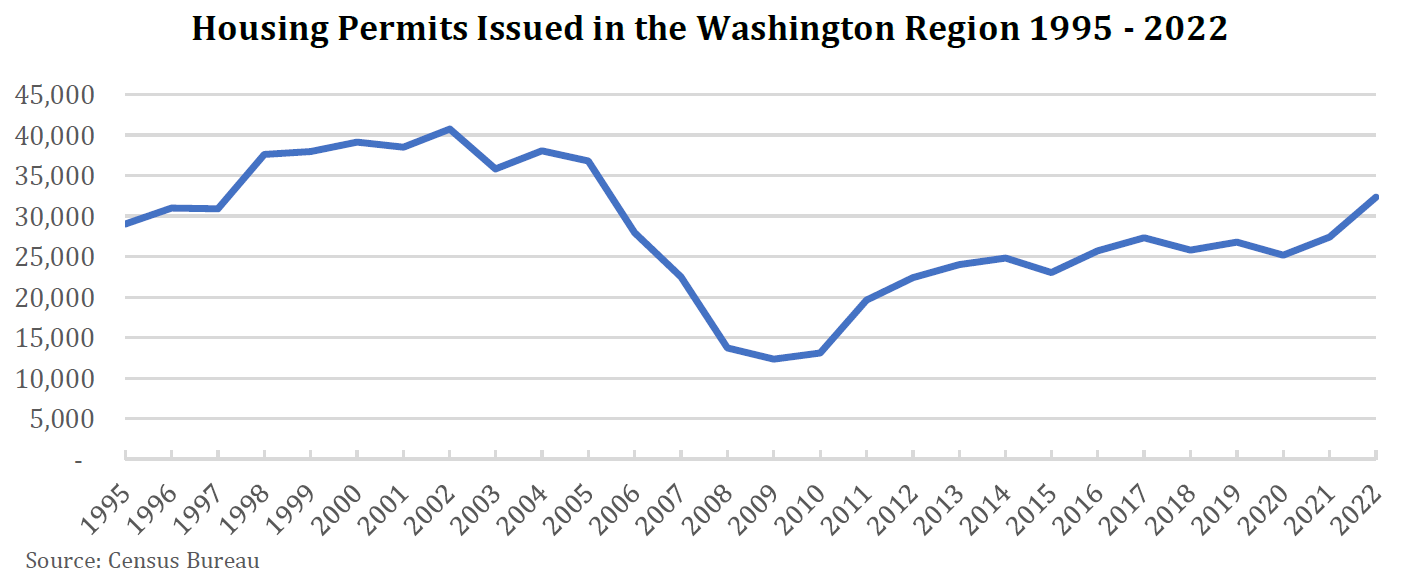
Over the past 27 years, the number of permits issued in the Washington region has varied notably. The number of housing permits issued hovered around 30,000 from 1995 to 1997 before jumping to about 38,000 or above until the housing bust that caused the Great Recession/Global Financial Crisis (GFC). As builders adjusted to market and lending conditions during the Great Recession, issued housing construction permits dropped to a low of 12,329 in 2009. From the 2009 low, the number of permits rebounded to 24,033 in 2013 and remained around 25,000 through 2020. Despite having economic and population growth in the region, the annual number of permits issued remains well below pre-GFC levels, but there has been a recent uptick in part due to the surprising strength of housing demand during the COVID-19 pandemic. Permits issued increased from 25,166 in 2020 to 27,414 in 2021 and 32,296 in 2022.
Housing Permits and Population Growth
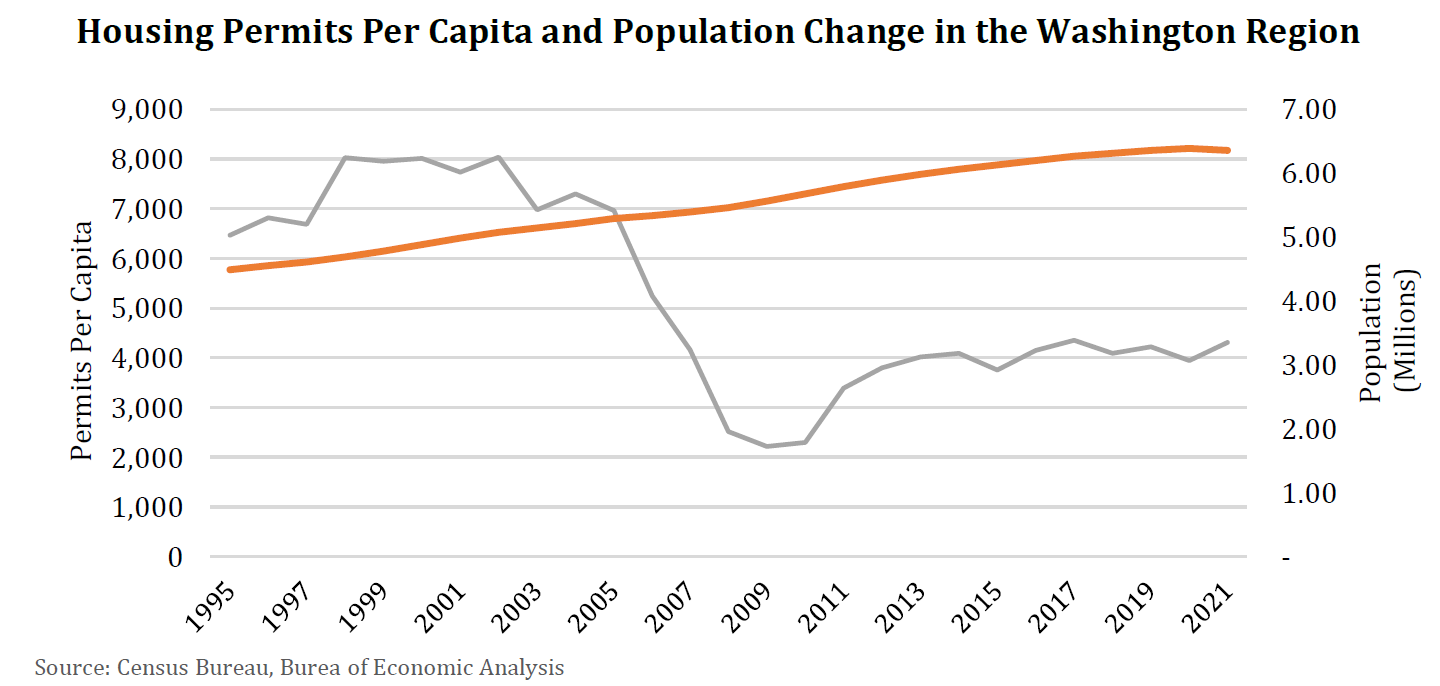
Despite housing permits in the Washington region having dropped precipitously during the Great Recession and staying abnormally low for more than a decade the region’s population grew at a near constant rate of about 1.4% from 1995 through 2020.[1] The Washington region’s population increased from 4.49 million in 1995 to 6.46 million in 2022. Taking population trends into account, the drop in housing construction permits becomes more stark. The number of housing permits issued per million people declined from 8,035 in 2002 to 2,217 in 2009.[2] Following the contraction, the number of permits per million people partially rebounded to roughly 4,000 from 2012 through 2021. Despite the uptick in housing permits in 2021 and 2022, if the region issued permits at the same rate per million residents as in 2002, the region would have issued a total of 51,072 permits in 2021, 23,658 (86%) more than were issued.
Housing Permits by Number of Units in Structure
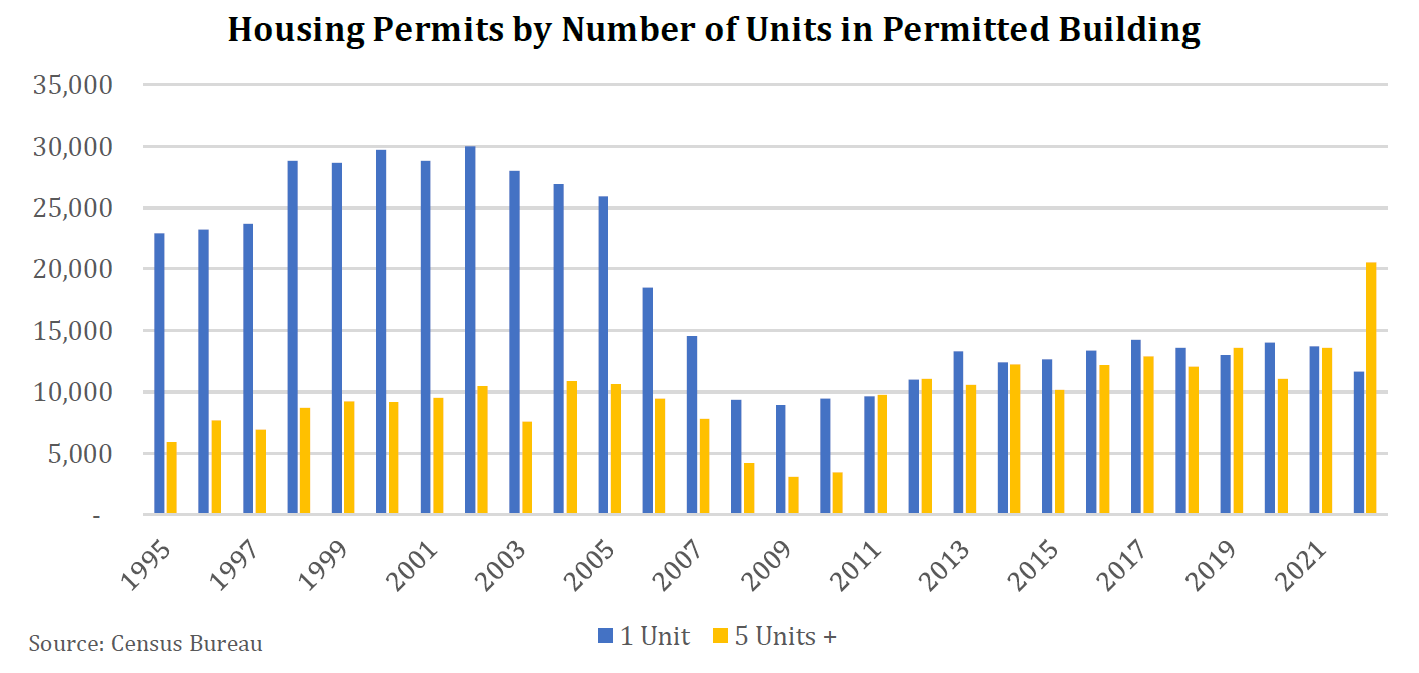
Variation in housing permits in the Washington region over the past 27 years has been driven partly by a switch away from single unit permits in favor of structures with 5 or more units. The decline in housing permits has been nearly completely attributable to the decline in permits of single unit homes. Permits for single unit homes increased from 22,892 in 1995 to 30,002 in 2002, before declining to 8,954 in 2009. Following the 2009 low, permits of single unit homes in the Washington region remained at roughly 12,000 through 2022. The number of permits for homes in buildings with 5 or more units increased to a peak of 10,882 units in 2004 before declining a similar 71.3 percent to 3,119 in 2009. Following this decline, however, the number of housing permits in buildings with 5 or more units rebounded quickly to remain around 12,000 through 2021 before increasing sharply to 20,544 in 2022. Housing permits in buildings with 2 to 4 units are comparatively negligible. Following the slowdown in economic activity associated with 2008 recession, localities in the Washington region approved fewer single unit housing permits and more permits in buildings with more than 5 units, a trend that dramatically accelerated in 2022.
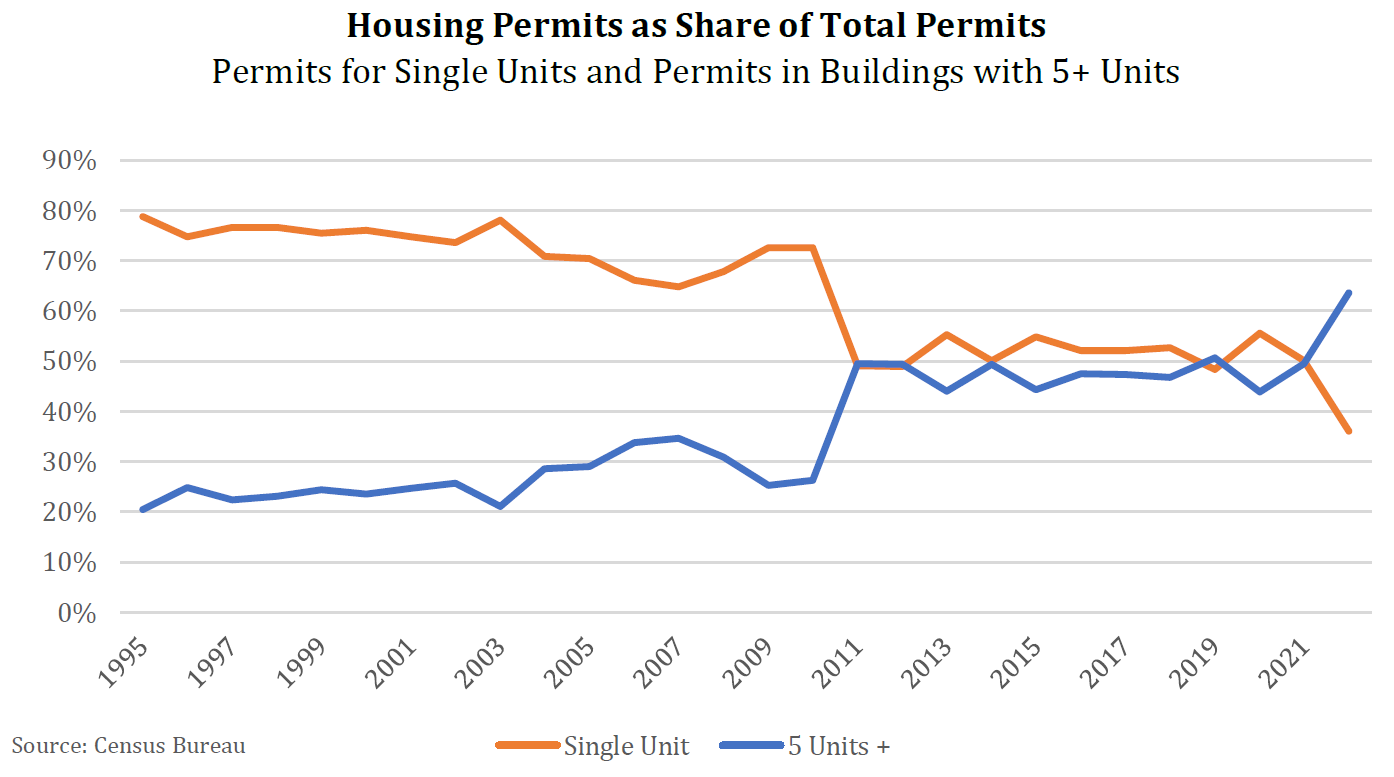
The switch away from single unit housing towards 5+ unit structures is clearly seen when shown as percentages of all permits. From 1995 to 2007, single unit permits as a share of all permits slowly declined from 78.8 percent to 64.8 percent before sinking to 49.1 percent in 2011 and remaining below 55.3 percent thereafter. The share of housing permits in buildings with 5 or more units rose increased from 26.3 percent in 2010 to 49.6 percent in 2011 and remained above 43.9 percent through 2021 before increasing sharply to 63.6 percent in 2022. The dramatic increase in 2022 resulted from the abrupt increase in the number of permits in structures with 5 or more units.
Conclusion
Home permitting in the Washington region has varied dramatically over the past 27 years. From 1995 to 2005, housing permits increased and remained elevated before declining rapidly through 2009. After remaining relatively subdued through 2021, the number of housing permits increased rapidly in 2022. The subdued housing permit activity from 2009 through 2020 is plausibly due to the collapse in housing prices following the Great Recession. After the Great Recession, the median price of sold homes in the Washington Region declined from approximately $415,000 in 2008 to $265,000 in the beginning of 2009 and did not recover to 2008 levels until 2018. If construction costs do not align with market prices of new homes, then builders would not apply for permits Although the number of housing permits has recently increased, the region is still permitting far below levels recorded from 1995 to 2005 when adjusted for population. In addition to permitting at lower rates, issued permits have dramatically shifted away from single unit structures in favor of units in structures with 5 or more units. Overall, permitting in the Washington region can be characterized by substantial permitting of single unit homes from 1995 through 2005 before a contraction in all permitting associated with the economic downturn of the 2008 recession and finally a shift away from single unit structure towards permitting of multi-unit structures.
About These Data
Housing permit data are sourced from the US Census Bureau. They are collected via the Building Permits Survey (BPS). The BPS collects data on the number and valuation of authorized housing units by the number of units in the structure. The statistics only include privately owned buildings. One unit structures include single-family detached, semi-detached, row houses, and townhouses. Classifications with more than 1 unit are multi-family structures. For the BPS, the Census Bureau updates MSA definitions as they are revised each January. For example, if the OMB updates the MSA definition in September of 2021, then the Census Bureau waits 4 months and updates the MSA definition in January 2022 for the entire year.
The population data are sourced from the Bureau of Economic Analysis (BEA). The BEA sources population from the U.S. Census Bureau midyear populations estimates. BEA uses the March 2020 MSA definition produced by the Office of Management and Budget (OMB). While the MSA definition the BEA uses is static while the BPS varies each year, the 2020 MSA definition only includes 3 additional counties in VA as compared with 2003 MSA definition. Thus, the impact of geographic differences in the third figure is likely to be negligible. The three additional counties in Virginia, Culpeper County, Madison County, and Rappahannock County
[1] As 2022 population have not been released, the data are truncated at 2021. The exception to population growth is a 0.5 percent decline from 2020 to 2021.
[2] A note on geographic differences between the datasets is discussed the “About These Data” section.
[i] Schuetz, Jenny. 2020. “To improve housing affordability, we need better alignment of zoning, taxes, and subsidies.” Brookings Institution.
[ii] Pinto, Edward, and Tobias Peter. 2021. “Walkable Oriented Development: An Opportunity for the Great Reset.” The American Enterprise Institute.