
Keith Waters and Terry Clower
Download Full Report as a PDF>>
Population Change in the Washington Region
One of the major shifts in the structure of the U.S. economy over the past 20 years has been the employee-employer location dynamic. Traditional labor markets operated on the rule that workers migrated to jobs. More recently that tradition has shifted. Increasingly, companies locate where skilled workers reside. This means that regional population change has become a key indicator of regional economic competitiveness. In this post, we examine the recently released county level population estimates from the U.S. Census Bureau, including the components of population change. These components include natural change (births minus deaths), net international migration (international migrants coming to the region less those who are leaving), and net domestic migration among U.S. residents. See the data note at the end of this article on the Census Bureau’s population estimated program, but keep in mind that the program compares population counts for a 12-month period starting on July 1 of a given year. Overall, while the Washington region’s population increased from July of 2021 to July of 2022, after declining the prior year, domestic out-migration rates for the region’s two largest jurisdictions, Fairfax County and Montgomery County, are among the worst in the nation for counties with more than 1 million population.
Population Change
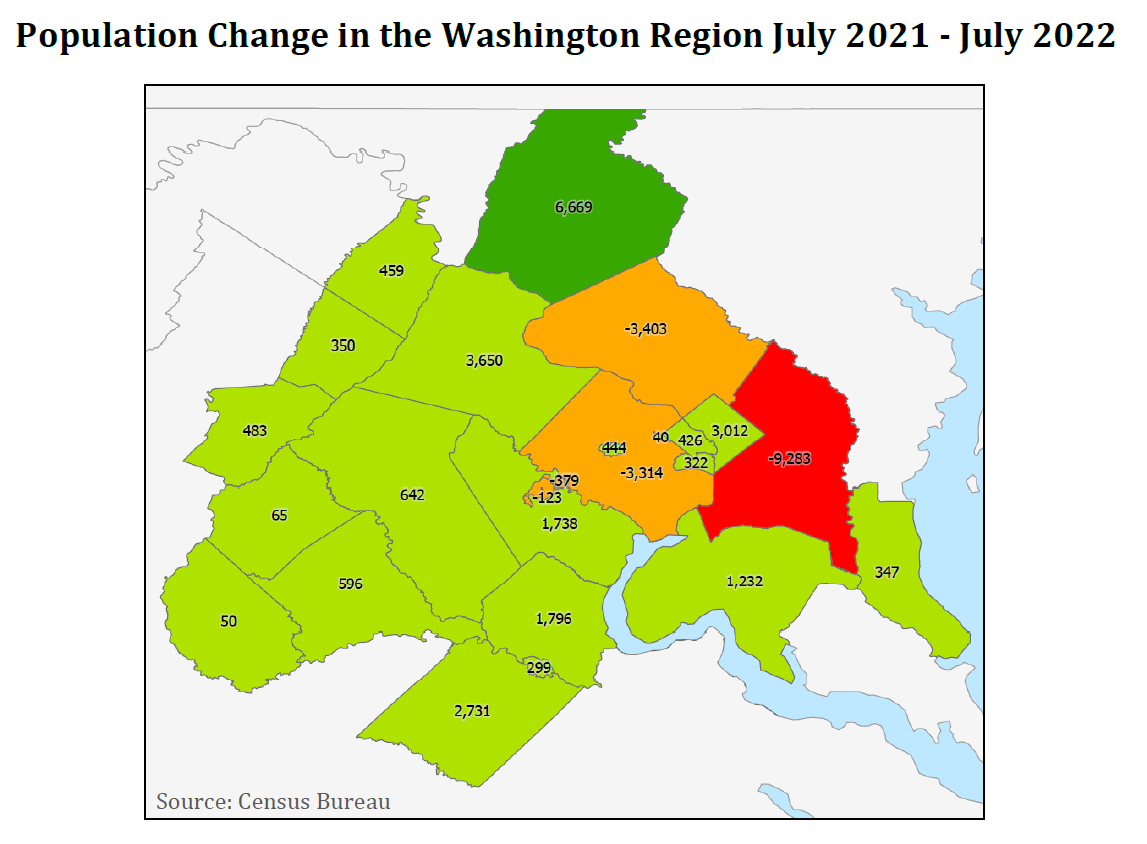
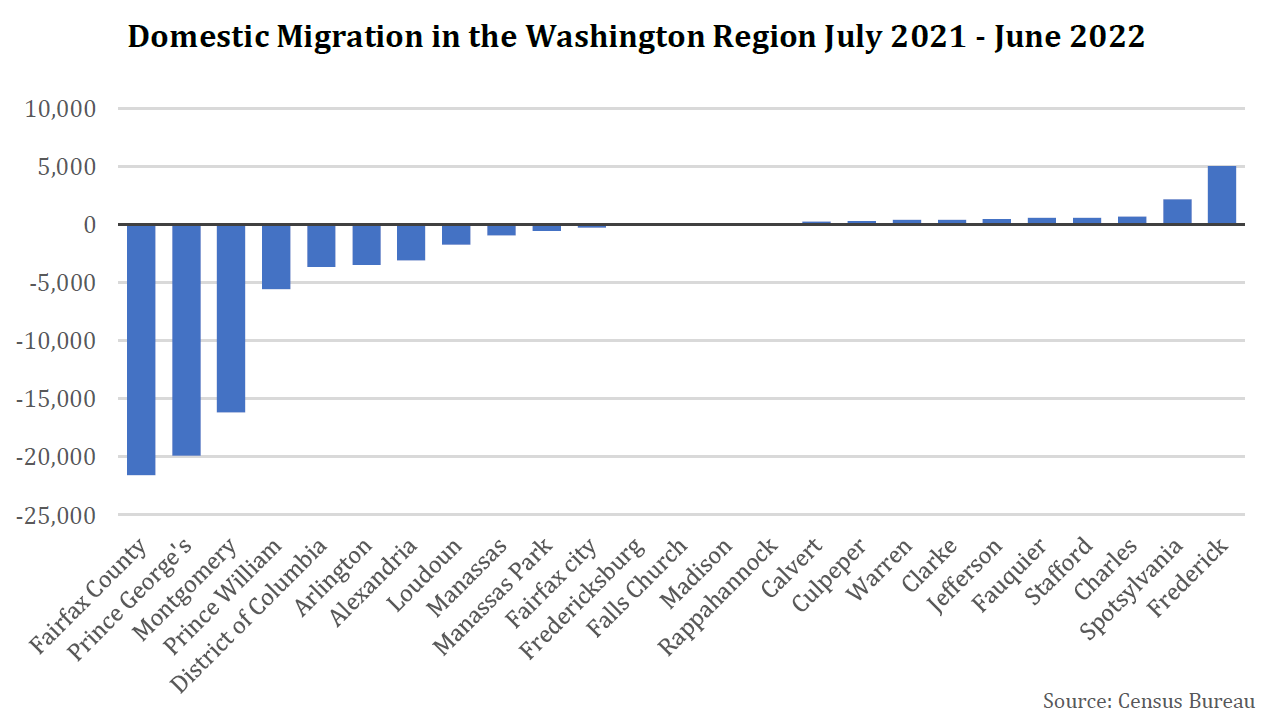
Census population data show that the Washington region’s population declined 1,772 from July 2020 to July 2021. However, as we recovered from the COVID-19 pandemic, the region’s population bounced back with a net gain of 8,849 persons from July 2021 to July 2022. Despite overall regional gains, three of our four largest jurisdictions recorded a second consecutive year of net population loss. Prince George’s County recorded the largest decline, with population decreasing 9,283. Fairfax County and Montgomery County recorded similar population losses of 3,403 and 3,314, respectively. The District of Columbia was the only large jurisdiction to gain population from July 2021 to July 2022, recording a net population increase of 3,012. Among all jurisdictions in the Washington region, Frederick County recorded the largest population increase, gaining 6,669 people from July 2021 to July 2022. Loudoun and Spotsylvania both recorded notable population increases.
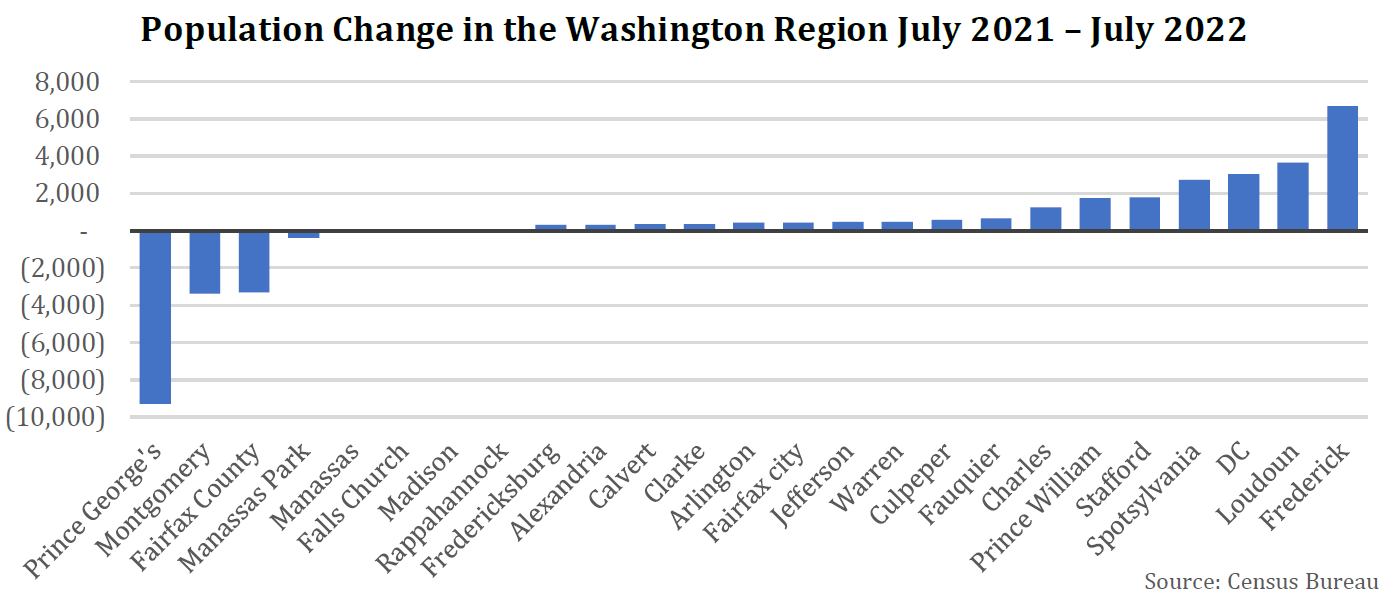
Geographically, it was the region’s core suburbs of Prince George’s, Montgomery, and Fairfax, that recorded the largest population losses. The denser, more urban suburbs of Arlington, VA and Alexandria, VA experienced small population growth along with DC. However, it was the region’s exurban counties that recorded the largest population increases with notable gains in Stafford, Prince William, and Charles counties, in addition to the previously mentioned Loudoun County and Spotsylvania County. In the coming months we will be examining the reasons why our largest suburban counties are shedding population, but housing costs and the shift to hybrid and remote work are undoubtedly key issues.
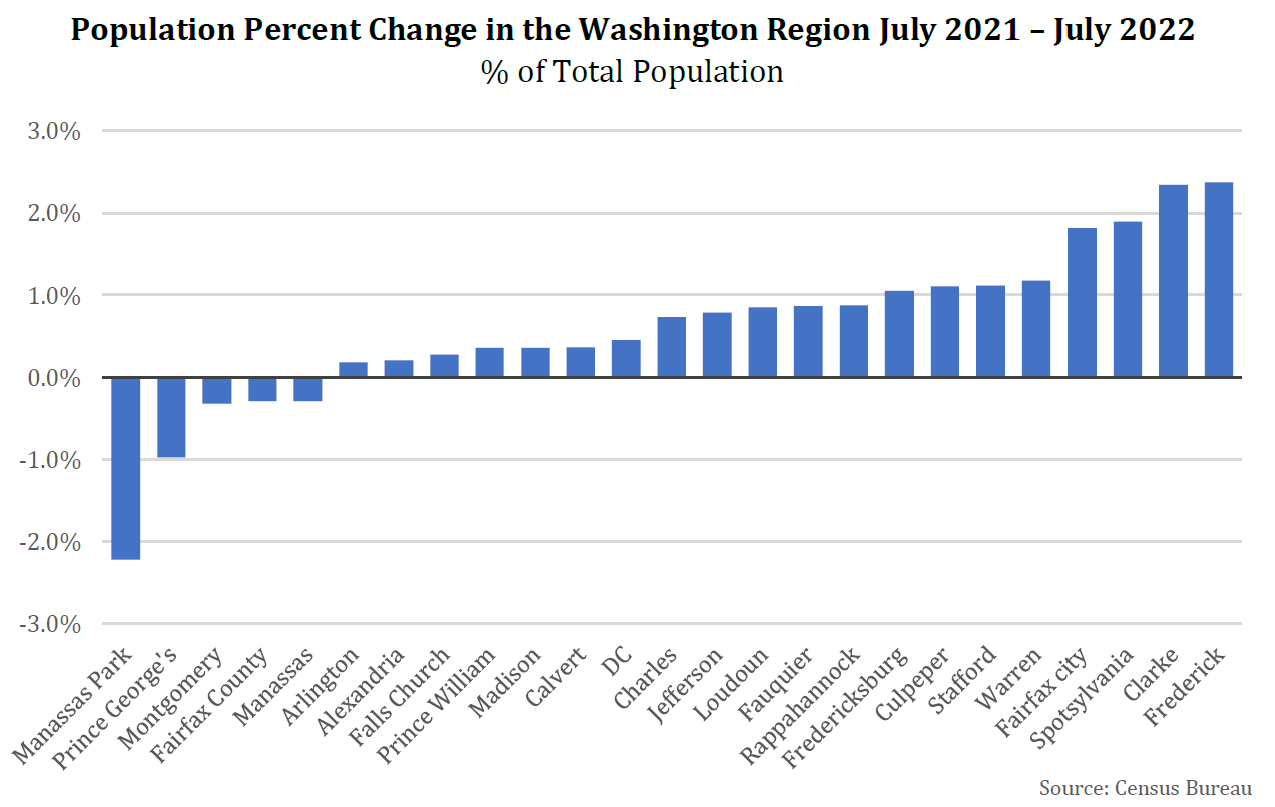
Examining the most recent population trends as percentage change, the rates of population decline for Prince George’s County (-1%) and Manassas Park (-2.2%) are notably larger than Fairfax County and Montgomery County. Frederick County recorded the largest population change both in terms of absolute change and as percent change (2.4%). While some small counties recorded larger growth rates, in level terms the change is small, such as Clark County. Spotsylvania County recorded the third largest gain in percentage terms (1.9%), a gain that was also notable in absolute terms (+2,731).
Components of Change
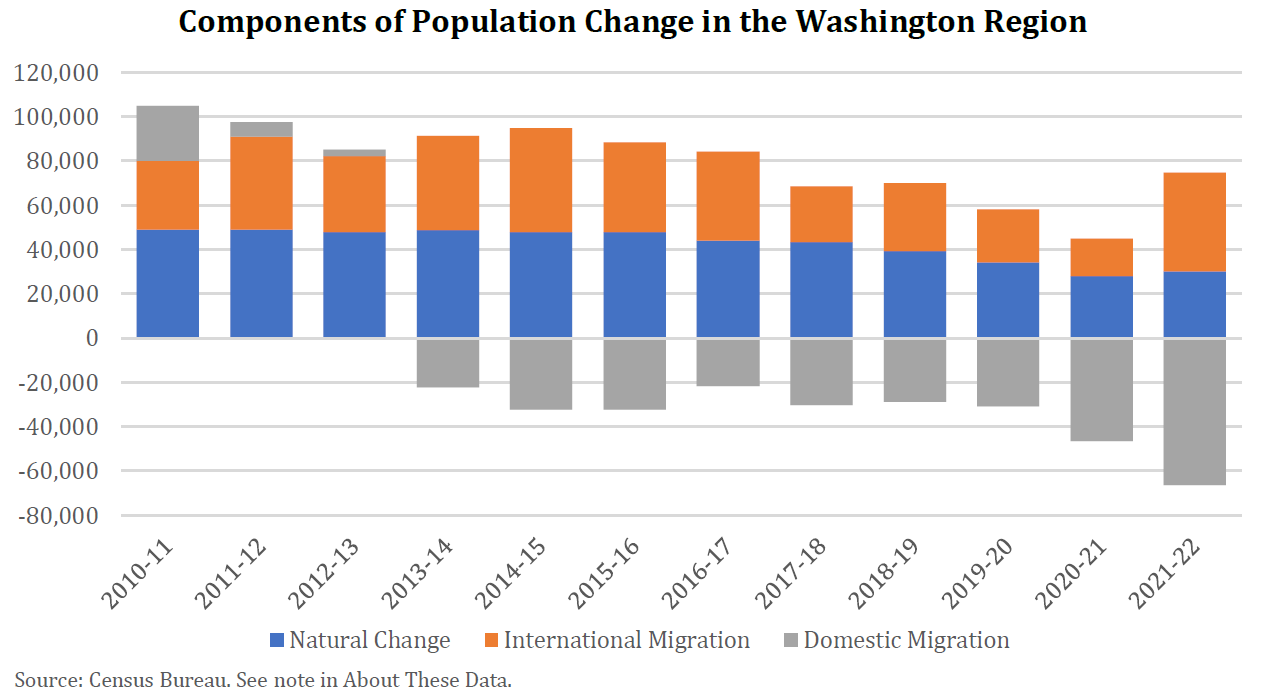
The components of change reveal the primary cause for concern for the Washington region, population losses are the direct result of worsening domestic out-migration. In the years leading up to the pandemic (see note in About These Data), the region was losing domestic migrants. From July 1st 2019 through June 30th 2020, the Washington region recorded a net domestic out-migration of 30,953, in line with estimates from prior years. However, domestic out-migration accelerated with the region losing a net of 46,497 domestic migrants from July 1st 2020 through June 30th 2021, and 66,441 from July 1st 2021 through June 30th 2022. Off-setting the worsening domestic out-migration has been a recent surge in net international migration, which reached +44,680 for the period from July 1st 2021 to June 30th 2022. This level of international migration takes the region back to long run trends that were disrupted by the pandemic and policy decisions during the previous administration.
Among jurisdictions in the Washington region, Fairfax County recorded the largest domestic out-migration of any jurisdiction in the region with a net loss of -21,573 from July 1st 2021 to June 30th 2022. Prince George’s County (-19,902) and Montgomery County (-16,188). Frederick recorded the largest domestic net in-migration at 5,001 new residents.
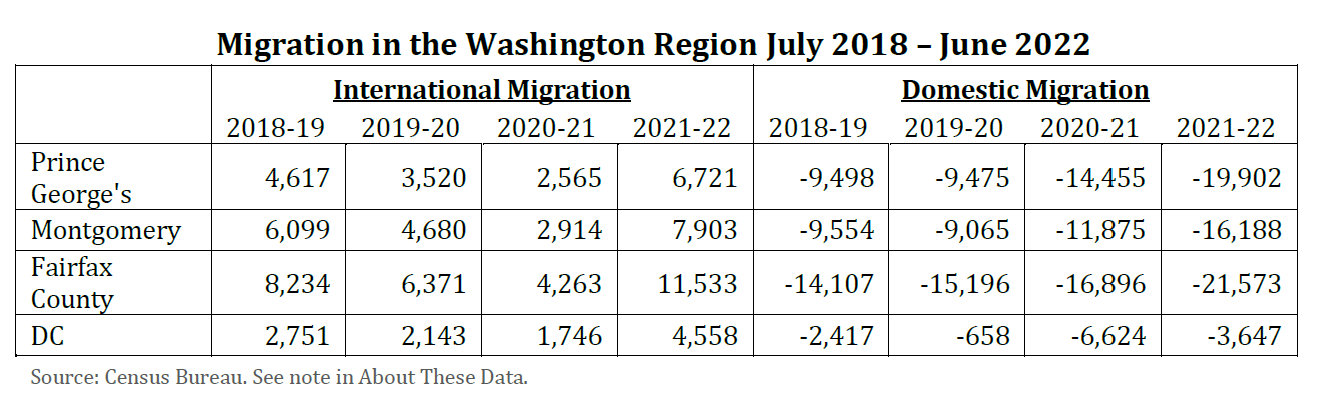
Keeping in mind data limitations, examining international and domestic migration in the three largest jurisdictions over the past four years reveals two key patterns. First, international in-migration accelerated in all jurisdictions over this period. Second, domestic out-migration also accelerated in three core suburban counties (Prince George’s, Montgomery, and Fairfax counties). Domestic out-migration is slowing in DC, which is one bright spot in an increasingly troubled real estate market in the District.
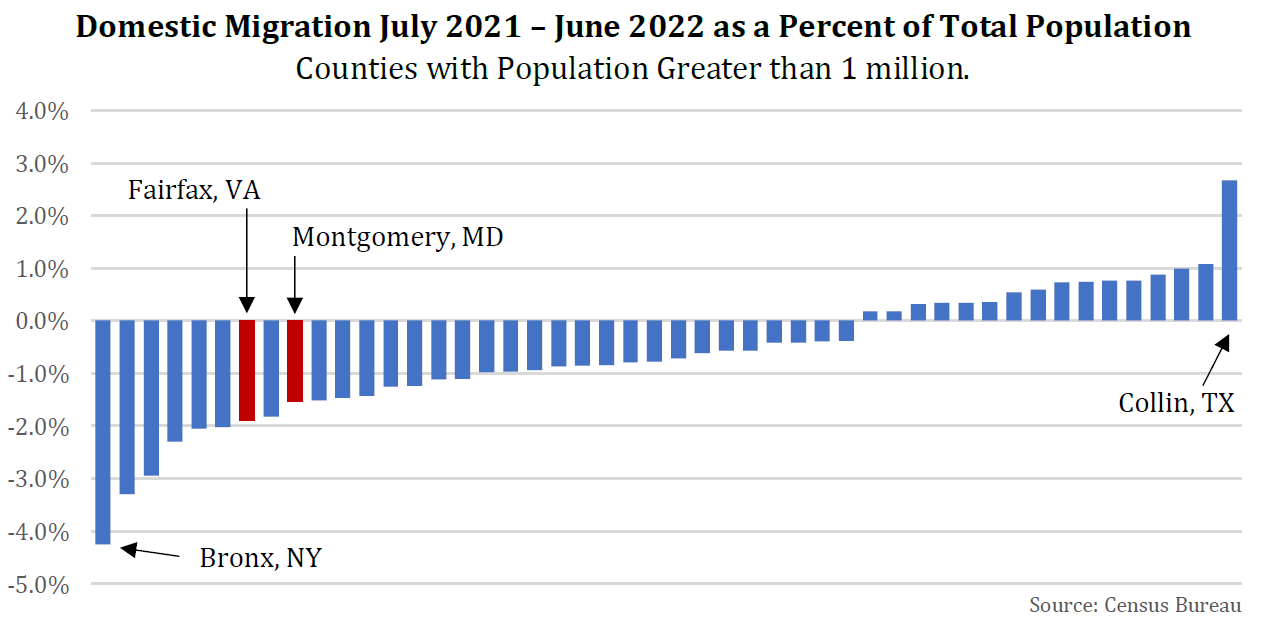
Comparing net domestic migration as a percentage of total population for the nation’s largest counties reveals that Fairfax County and Montgomery County are underperforming compared to peer counties in other parts of the nation. Core New York City Counties (Bronx, Queens, Kings), Silicon Valley (Santa Clara, Alameda), and downtown Philadelphia are the only counties doing worse. Cook County, Illinois (Chicago) falls between Fairfax and Montgomery on this “worst of” list. Among the 16 large counties recording net domestic in-migration for the year ending June 30th 2022, eight were in Texas or Florida with others in North Carolina, Georgia, Arizona, and California. New York County (Manhattan) bucked the overall NYC trend with a small gain in domestic migration.
Conclusion
While the population of the Washington region rebounded from recent losses, our trends in domestic migration remain troubling. We can assume that some of the losses among core large jurisdictions became gains in more distant suburbs. However, we still saw a net outflow of residents from the region, and our anecdotal evidence suggests these are not just retirees moving to the Outer Banks. Our employers are losing prime age workers to competing regions of the country. Moreover, domestic out-migration appears worse in the Washington region than in many other major suburban counties. In upcoming work, we will be exploring strategies for regaining the Washington, DC region’s attractiveness as a vibrant place to build a career and life.
About These Data
All data in this report use the MSA definition released by the Office of Management and Budget March, 6th 2020. Population estimates marked 2020-2021, and 2021-2022 come from the Vintage 2022 data from the U.S. Census Bureau Population Estimates Program released March 2023 (CO-EST2022-ALLDATA). This vintage includes population estimates as well as components of change for years 2020 to 2022. The data are revised from the base year (e.g. 2020) and July 1st of the current year. While the decennial Census typically provided the base, a modified base was used for 2020 due to various issues, which is partly related to the pandemic. Population estimates marked 2010-2011 through 2019-2020 come from the county population estimates released May 2021 (CO-EST2020-alldata). Each new vintage supersedes previous vintages. Although estimate errors increase as time from the base year increases, meaning that 2020 estimates from prior to the 2020 Census will not align with those after the 2020 Census, we provide estimates from the May 2021 dataset to compare pre-pandemic domestic migration trends. Births and Deaths data come from the National Center for Health Statistics. Migration estimates are derived from Internal Revenue Service tax data, Medicare enrollment data, Social Security Administration Data. Group Quarters data are estimated using data from the military, the Department of Veterans Affairs, and state partners. Population estimates are from the period July 1st to July 1st. For example, July 1st 2020 to July 1st 2021. However, Natural increases, domestic migration and international migration are from the period July 1st through June 30th. For example, July 1st 2020 to June 30th 2021.