
Download Full Report as a PDF>>
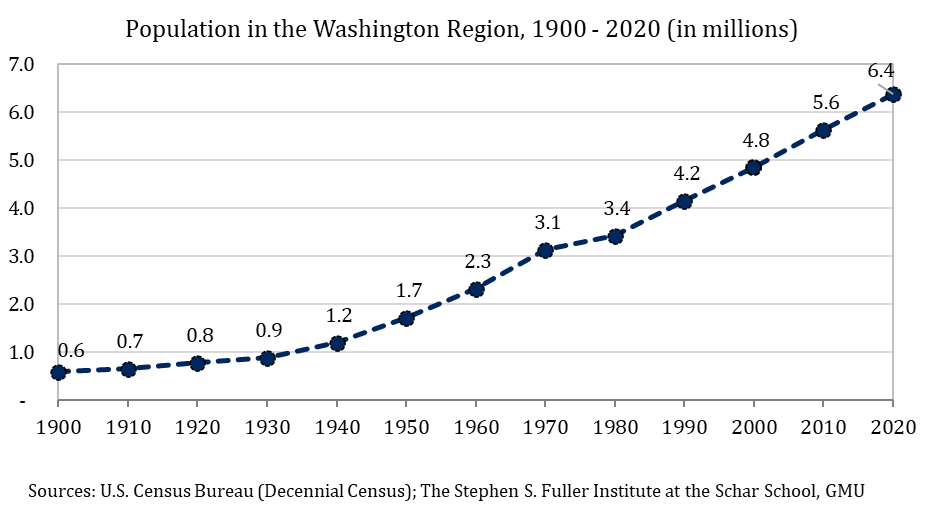
As of April 1, 2020, the Washington region was home to 6,371,325 residents, an increase of 735,093 people and 13.0 percent from April 1, 2010. These totals are the result of the once-a-decade full population count produced by the Decennial Census and are the most complete source of information on population in the region and the U.S. The U.S. Census Bureau released population counts by race and ethnicity for all geographies in the U.S. on August 12, 2021 and more details, including population by age, will be released in the upcoming year.
Between 2010 and 2020, the Washington region’s population growth patterns deviated from prior trends:
- the region’s growth slowed to 13.0 percent, its smallest gain since the 1970-1980 period;
- the District of Columbia had the largest increase of the sub-state areas at 14.6 percent, and led the sub-state areas in terms of percentage growth for the first time since the 1930-1940 period;
- the population in Northern Virginia increased 14.4 percent and had the largest deceleration in growth of the sub-state areas; this increase was its smallest since the 1920-1930 period;
- population growth in Suburban Maryland lagged regional gains, rising 11.1 percent, and was its smallest gain since the 1970-1980 period; and
- the geographic distribution of population growth was the most even since the 1930-1940 period.
The region’s population continued to become more racially and ethnically diverse during the 2010-2020 period:
- the number of white and not Hispanic people decreased 2.2 percent and included losses in 13 of the region’s 24 jurisdictions;
- the number of Black and not Hispanic people in the region increased 8.3 percent, which was slower than the overall growth rate for the second consecutive decade;
- the number of Hispanic or Latino people increased 41.2 percent, ranking second of all major race and ethnic groups;
- the number of Asian or Pacific Islander and not Hispanic people increased 34.9 percent, ranking third; and
- growth was led by people that identified as more than one race or a race other than white, Black, Asian or Pacific Islander, which more than doubled (+101.2%) between 2010 and 2020.
The slowdown in overall population growth, the changing geographic distribution of gains, and the increasing racial and ethnic diversity in the past decade will continue to shape the Washington region in upcoming years. The moderation in population gains occurred during a period of subdued economic growth (excluding the pandemic), and these patterns typically align. The two, consecutive decades of population gains in the District marks a reversal from its losses during the 1950-2000 period, while growth in Northern Virginia slowed to its smallest decade-long rate since the 1930-1940 period. The region’s population continued to diversify during the 2010-2020 period after becoming majority minority in 2008. The shifting geography and the relatively fast rate of diversification indicate that the underlying population trends are more dynamic than the topline slowdown would suggest. As a result, the sub-population trends will be increasingly more important in upcoming years.
Population in the Washington Region: 1900 – 2020
The Washington region was home to 6,371,325 people as of April 1, 2020, an increase of 735,093 people from 2010 (+13.0%). While this growth was stronger than the national increase of 7.4 percent, it was the smallest ten-year gain for the region since the 1970-1980 period. Of the sub-state areas, the District had the largest population growth, increasing by 14.6 percent. This is the largest increase for the District since the 1940-1950 period. Northern Virginia’s population increased by 14.4 percent and had the largest deceleration in growth compared to prior decades. Gains in Northern Virginia were the smallest since the 1920s. Suburban Maryland’s population increased 11.1 percent and lagged growth elsewhere in the region and reached its smallest ten-year gain since the 1970s.
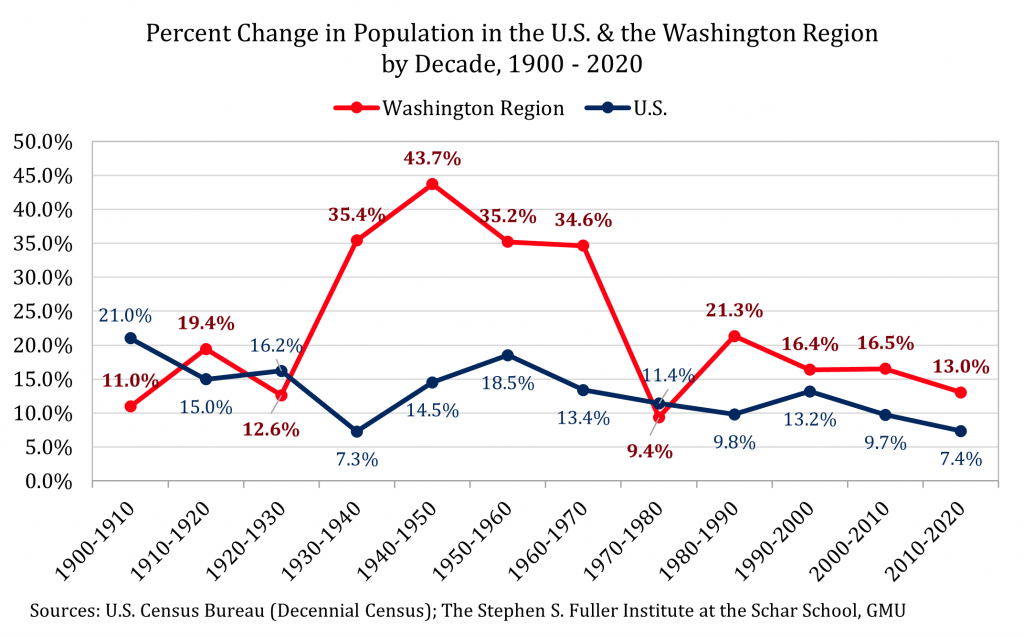
Prior to WWII, the Washington region’s population growth was relatively subdued. Between 1900 and 1910 and between 1920 and 1930, the region’s population grew more slowly than the nation’s, overall. During WWI, the region’s population growth accelerated modestly. Even with this temporary acceleration, population growth during this thirty-year period was smaller than the nation’s. This trend reversed in the 1930s and the region’s population grew more quickly than the nation’s in eight of the nine decades that followed. The strongest growth occurred between 1930 and 1970: 1930s (+35.4%), 1940s (+43.7%), 1950s (+35.2%), and 1960s (+34.6%). During this forty-year period, the region’s population more than tripled (+254.2%), while the nation’s population increased 65.0 percent. After forty years of strong growth, the region’s population gains moderated in the 1970s, rising 9.4 percent during the decade. Nationally, the population increased 11.4 percent and the 1970s were the final of three decades when the region’s growth underperformed that of the nation’s in the past 120 years (1900s, 1920s, and 1970s).
In the 1980s, population growth in the Washington region accelerated from its 1970s level and outpaced national growth. Gains between 1990 and 2010 slowed compared to the increase in the 1980s but remained stable, rising 16.4 percent in the 1990s and 16.5 percent between 2000 and 2010. Between 2010 and 2020, the regional population increased 13.0 percent, marking its smallest ten-year gain since the 1970s. Nationally, population growth was strong between 1990 and 2000 and has tapered since. The national deceleration was relatively sharp and the national gains between 2010 and 2020 were the smallest since the 1930s. Overall, the Washington region continued to outperform the nation in terms of population growth in the past decade and population gains were more stable than the nation’s during the past three decades.
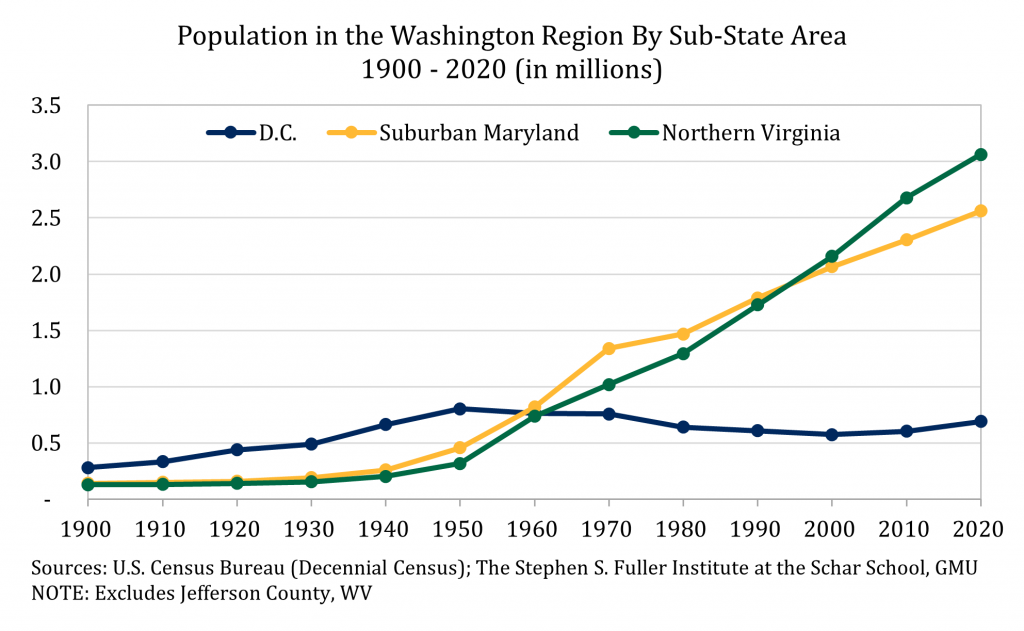
Northern Virginia was home to nearly one-half (48.1%) of the region’s population in 2020, or 3,063,700 people. Suburban Maryland was home to 2,560,379 people and accounted for 40.2 percent of all the region’s population. The District of Columbia had 689,545 residents, accounting for 10.8 percent of the region’s population. This distribution has changed substantially since 1900. Between 1900 and 1940, population gains were disproportionately driven by the District of Columbia. In 1900, 47.0 percent of all the region’s residents lived in the District. By 1940, this share had increased to 55.4. During the 1950s, growth in the rest of the region accelerated, led by Suburban Maryland. This pattern continued through 1970 and Suburban Maryland had the fastest growth of the substate areas followed by Northern Virginia. During this period, gains in the District initially slowed (1950s) and were followed by two decades of modest declines: 1950s (-4.8%) and 1960s (-1.0%).
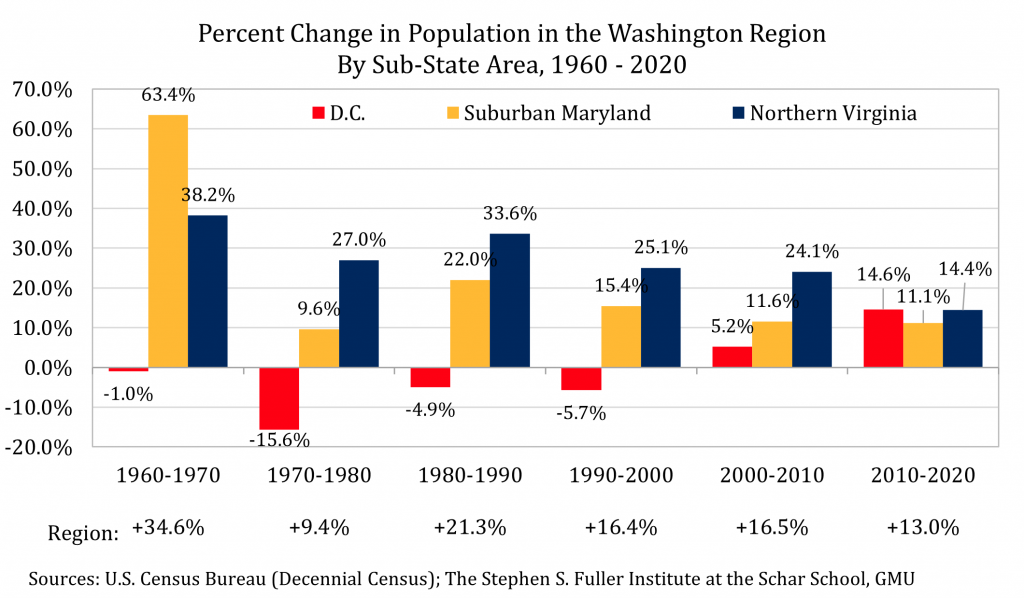
The population patterns in the Washington region shifted again in 1970. The District had its largest population losses during this decade, decreasing by 15.6 percent. Suburban Maryland’s population growth slowed, while gains in Northern Virginia accelerated and led the region’s growth. Population changes in the 1980s and 1990s were similar: the largest increases occurred in Northern Virginia, Suburban Maryland had moderate gains and the District had population declines. Population growth resumed in the District during the 2000-2010 period, marking the first decade in which all three sub-state areas had gains since the 1940s. Growth remained strongest in Northern Virginia (+24.1%) and gains in Suburban Maryland (+11.6%) lagged the region’s overall.
Between 2010 and 2020 the Washington region’s population increased 13.0 percent, including gains in each of the sub-state areas: D.C. (+14.6%), Northern Virginia (+14.4%), and Suburban Maryland (+11.1%). For the first time since the 1930-1940 period, growth was led by the District, which also had its strongest 10-year gain since the 1940-1950 period when the population increased 21.0 percent. In combination with the gain during the 2000-2010 period, the District’s population reached its highest Decennial Census level since 1970. Northern Virginia had the second largest percentage growth of the sub-state areas, but this rate of increase was significantly slower than in prior decades. Northern Virginia’s growth from 2010 to 2020 was its smallest 10-year gain since 1930. Population growth in Suburban Maryland modestly lagged the regional increase during the 2010-2020 period and growth slowed to its smallest level since the 1970s. Altogether, the geographic distribution of population gains in the Washington region in the past decade was the most even since the 1930-1940 period due to the rebound in gains in the District and the deceleration of growth in Northern Virginia.
Of the jurisdictions in the Washington region, growth in the past decade was led by Loudoun County, VA both in percentage and absolute terms. Loudoun County added 108,648 residents and increased 34.8 percent between 2010 and 2020. The county with the second largest percent increase was Stafford County, VA, which increased by 21.7 percent (+27,966 residents). Manassas Park City, VA increased by 20.6 percent and Prince William County, VA increased by 20.0 percent, ranking third and fourth, respectively. The jurisdiction with the second largest absolute increase was Prince George’s County (+103,781 residents and 12.0%), followed by Montgomery County, MD (+90,284 residents and 9.3%). Of all 24 jurisdictions in the Washington region, 23 had more residents in 2020 than in 2010. The only jurisdiction with population declines was Rappahannock County, VA, which had 25 fewer residents (-0.3%). Calvert County, MD had the second smallest population change, increasing by 4.6 percent, while Clarke County, VA had the third smallest change (+5.3%).
Race & Ethnicity in the Washington Region: 2000 – 2020
Note: Prior to 2000, the Decennial Census used different race and ethnicity options and data for previous decades are not comparable.
The Washington region became increasingly racial and ethnically diverse between 2000 and 2020, becoming majority minority in 2008. Between 2000 and 2010, this shift was driven by slower growth in the number of residents that were white and not Hispanic and large gains in the number of Hispanic or Latino residents and residents that were Asian or Pacific Islander. Between 2010 and 2020, this shift was driven by both an absolute decline in the number of residents that were white and not Hispanic and large gains in other racial and ethnic groups, led by growth in multi-racial residents and Hispanic or Latino residents. Of the region’s 24 jurisdictions, ten were majority minority in 2020, two more than in 2010 and eight more than in 2000.
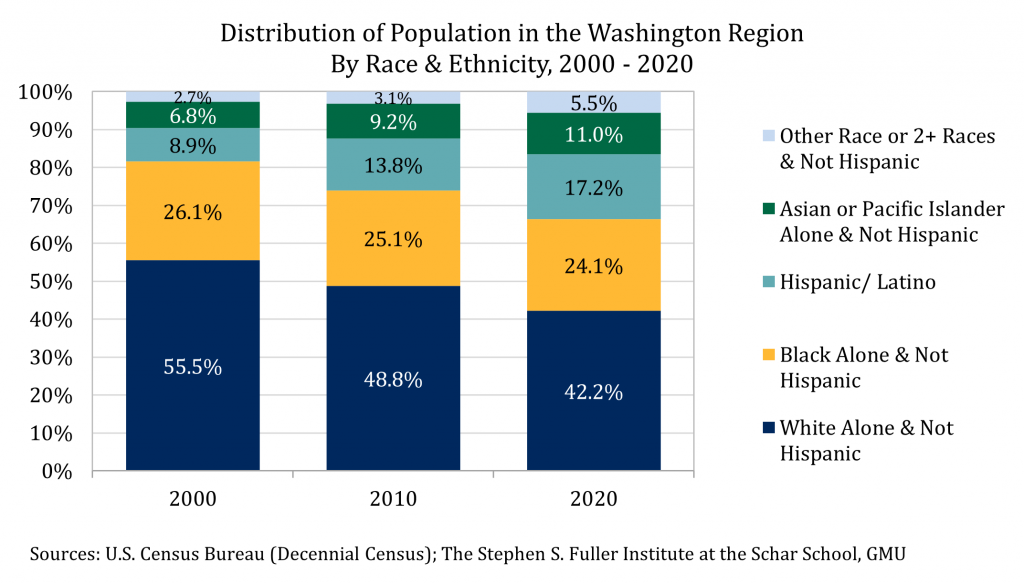
In 2020, the most common race and ethnicity continued to be non-Hispanic and white (and no other race) and this category accounted for 42.2 percent of all residents in the region (2,691,756 people). However, the region had fewer white and not Hispanic residents living in the region in 2020 than in 2010, decreasing by 59,637 residents and 2.2 percent. Between 2000 and 2010, this population increased 2.4 percent. While the 2010-2020 period was the first full decade of declines for white, non-Hispanic residents in the region, there were several annual declines for the region in the past two decades and seven jurisdictions had declines between 2000 and 2010. Between 2010 and 2020, 13 jurisdictions had declines in the number of white and not Hispanic residents with the largest percentage losses in Manassas Park City, VA (-22.5%), Charles County, MD (-19.8%) and Manassas City, VA (-17.7%). Of the 11 jurisdictions with gains, the largest percent increases were in the District (+25.0%), Loudoun County, VA (+11.3%) and Falls Church City, VA (+9.5%).
The second most populous category by race and ethnicity was Black (and no other race) and not Hispanic, which accounted for 24.1 percent of all people in the region (1,534,867 residents) in 2020. While the number of Black and non-Hispanic residents increased 8.3 percent (+117,864 residents) between 2010 and 2020, this percentage gain was smaller than the total gain of 13.0 percent. This is the second consecutive decade in which the population growth for non-Hispanic Black residents lagged the overall gains, as this population increased 12.4 percent between 2000 and 2010. As a result, a smaller share of the Washington region’s residents were Black and not Hispanic in 2020 compared to both 2010 and 2000. Nine of the jurisdictions in the region had a larger share of Black and not Hispanic residents in 2020 compared to 2010 and the largest percentage increases were in Stafford County, VA (+38.7%), Frederick County, MD (+37.7%), and Calvert County, MD (+36.6%). Six jurisdictions had an absolute decline in the number of Black and not Hispanic residents with the largest percentage decreases in Rappahannock County, VA (-37.7%), Clarke County, VA (-24.0%), Culpeper County, VA (-10.5%), and the District (-6.3%).
In 2020, there were 1,094,509 Hispanic or Latino residents (of any race) in the Washington region, accounting for 17.2 percent of all residents. This population increased 41.2 percent between 2010 and 2020, following an 80.0 percent increase between 2000 and 2010. During this two-decade period, the number of Hispanic or Latino residents in the region had the fastest growth of all the major race and ethnic groups, including the largest growth during the 2000-2010 period and the second largest gain during the 2010-2020 period. In the past decade, every jurisdiction in the region had significant gains in the number of Hispanic or Latino residents and the smallest increase was in Fairfax County, VA (+18.3%). The largest gains were in Stafford County, VA (+99.1%), Frederick County, MD (+87.4%), and Charles County, MD (+86.6%).
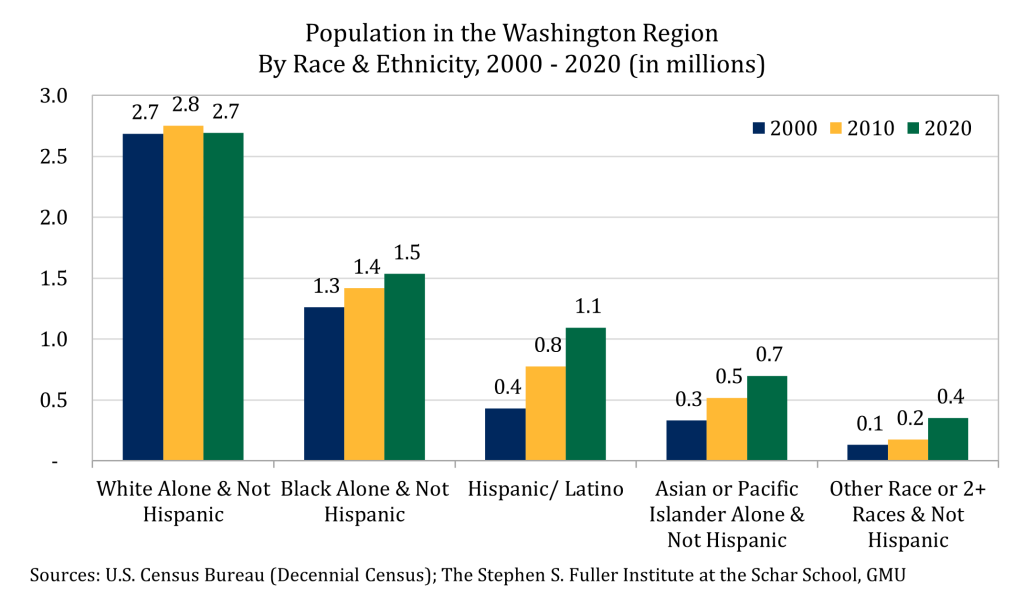
The number of Asian or Pacific Islander (and no other race) and not Hispanic residents in the Washington region increased 34.9 percent between 2010 and 2020 after rising 56.8 percent between 2000 and 2010. As a result of these gains, this population accounted for 11.0 percent of the region’s population in 2020, increasing from 9.2 percent in 2010 and 6.8 percent in 2000. Every jurisdiction in the region had gains in this category between 2010 and 2020, with the smallest increase in Prince George’s County, MD of 18.9 percent. The largest gains were in Fredericksburg city, VA (+96.6%), Loudoun County, VA (+95.0%), and Clarke County, VA (+78.6%).
The number of residents in the Washington region that were not Hispanic and identified as a race other than white, Black, Asian or Pacific Islander, or identified as more than one race more than doubled between 2010 and 2020, increasing 101.2 percent. This was the largest growth of any race and ethnicity and followed an increase of 34.5 percent between 2000 and 2010. These gains were primarily driven by non-Hispanic, multi-racial residents, which increased by 104.5 percent between 2010 and 2020 and 38.5 percent between 2000 and 2010. Overall, the number of multi-racial people and people identifying as another race accounted for 5.5 percent of all residents in the region, increasing from 3.1 percent in 2010 and 2.7 percent in 2000. All jurisdictions in the region had more residents in this category in 2020 than in 2010, with the smallest gain of 60.9 percent in Manassas Park city, VA. The largest gains were in Clarke County, VA (+176.1%), Warren County, VA (+170.2%), and Rappahannock County, VA (+168.2%).
Differences from Preliminary Data Releases: 2010 – 2019
The Decennial Census is a full count of all residents in the U.S. that occurs every ten years. During non-census years, the U.S. Census Bureau produces Population Estimates, which are primarily estimated using administrative data and are partially modeled. In turn, these Population Estimates are use as control totals in other data products like the American Community Survey and the labor force statistics produced by the Bureau of Labor Statistics. After the Decennial Census, the Census Bureau produces Intercensal Estimates that incorporate the final count and adjust the prior decade of estimates. That is, the Census Bureau will revise (or finalize) the population counts for the 2011-2019 period based on the 2020 Decennial Census. For 16 jurisdictions the Washington region, the adjustments will likely be small. However, six jurisdictions in our region may have had faster population growth than previously estimated, while two jurisdictions may have had slower growth than initially reported during the 2010-2019 period.
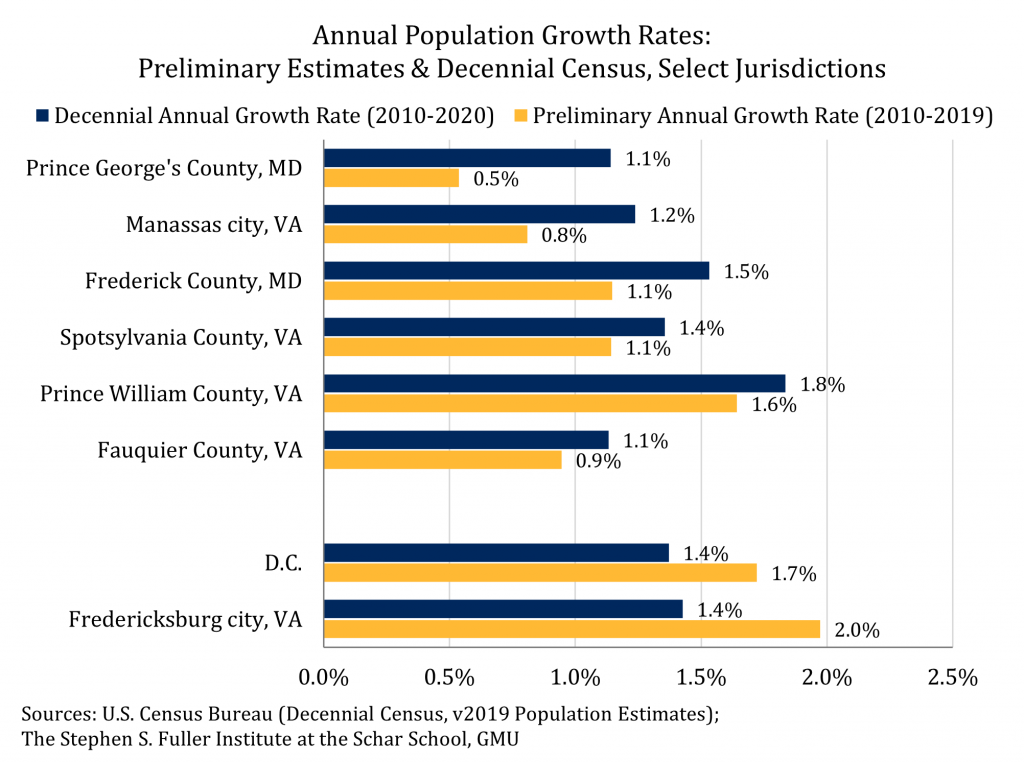
The Washington region’s population as reported by the Population Estimates (referred to hereinafter as the preliminary estimate) increased at an average annual rate of 1.1 percent between July 1, 2010 and July 1, 2019. According to the Decennial Census, the region’s population increased 1.2 percent per year between April 1, 2010 and April 1, 2020. It is not accurate to compare the July 1, 2019 estimate and April 1, 2020 count to determine the population change during that period. The difference in these estimates includes the cumulative model error, which is typically small for any year but compounds during the decade. Instead, the difference in growth rate suggests that the prior, preliminary estimates will be revised upwards, albeit modestly.
The largest likely revision will be an
upwards revision to the population in Prince George’s County, MD. Per the
preliminary estimate, Prince George’s County had an average annual growth rate
of 0.5 percent between 2010 and 2019; as measured by the Decennial Census, the
average annual growth rate was 1.1 percent between 2010 and 2020. In other
words, the Decennial Census indicates that the population grew at a rate that
was more than twice as fast as the preliminary estimates suggested. This was
the largest difference, both on percentage point and absolute bases, of all
jurisdictions in the region. Prince George’s County, MD also accounted for the
vast majority of the total difference in the regional estimates.

Five additional jurisdictions had Decennial Census counts that were notably larger than their preliminary estimates, suggesting that the populations in these jurisdictions were previously under-estimated. Manassas city, VA had the second largest percentage difference between the two datasets and the Decennial Census indicates that its population increased at an annual rate of 1.2 percent instead of the preliminary 0.8 percent. For Frederick County, MD, the Decennial Census reflects an annual population growth of 1.5 percent, which is 0.4 percentage points larger than the preliminary estimates. Spotsylvania, Prince William, and Fauquier counties in Virginia had annual gains that were 0.2 percent stronger according to the Decennial Census than the preliminary estimates suggested. These jurisdictions may also have upwards revisions to their population estimates for some or all of the 2011-2019 period.
Two jurisdictions had smaller population gains according to the Decennial Census than had been previously estimated. The population in the District of Columbia increased at an annual rate of 1.4 percent according to the Decennial Census; preliminary estimates were for an annual gain of 1.7 percent during the first nine years of the period. Similarly, Fredericksburg city, VA recorded an annual gain of 1.4 percent according to the Decennial Census, which is smaller than the preliminary estimate of 2.0 percent. The annual population estimates for these jurisdictions during the 2011-2019 may be revised downward from their preliminary releases.
The Decennial Census totals are not final. After the 2010 Decennial Census, the District, three counties in Northern Virginia and two cities and one town Suburban Maryland challenged their counts, which were revised.[1] Because of the low response rates and the methodology, which relied on internet self-reporting for the first time in the Decennial Census’s history, there may be more challenges to the 2020 data than in prior years. These challenges historically take up to four years to resolve, so the data that are released this year will be the most complete information available until then. Still, these data indicate that the preliminary estimates for the 2011-2019 period were consistent with the regional trends reflected in the Decennial Census, in total.
About These Data
All data are from the U.S. Census Bureau’s Decennial Census (years 1900, 1910, 1920, 1930, 1940, 1950, 1960, 1970, 1980, 1990, 2000, 2010 and 2020) or the vintage 2019 Population Estimates (years 2010-2019). The 2020 Decennial Census data included in this report were released on August 12, 2021 that included population by race and ethnicity for all residents and for residents aged 18 and older. The 2013 metropolitan statistical area delineation is used to define the Washington region for all years. After 1980, this definition consists of 24 jurisdictions; in prior years several independent counties in Virginia were not separately delineated and their populations totals are included with their surrounding counties.