
Download Full Report as a PDF>>
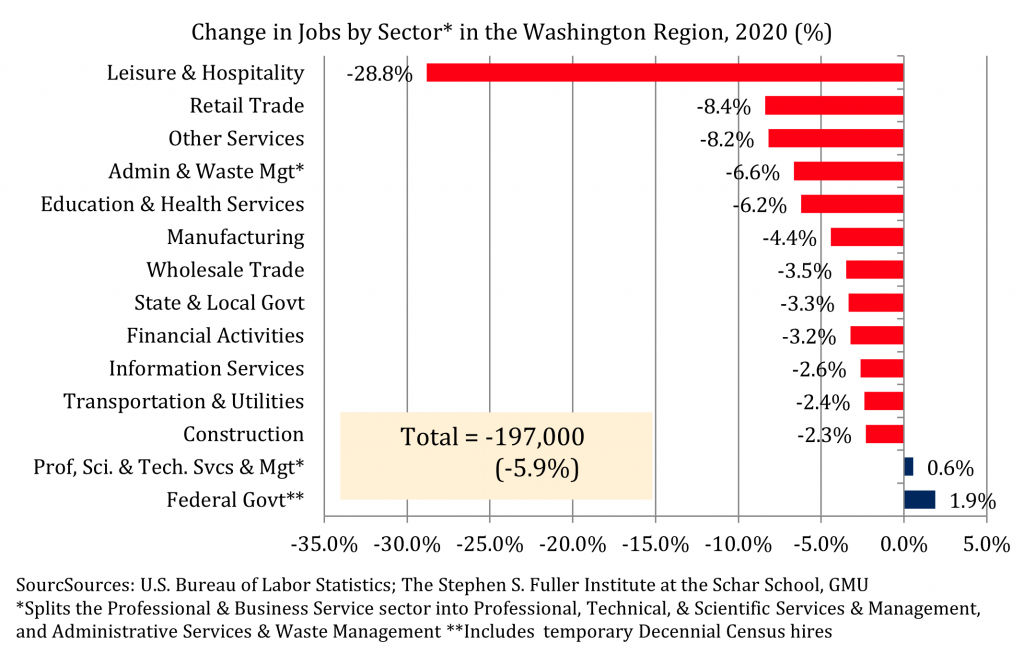
The Washington region lost 197,000 jobs in 2020 and the losses during the pandemic were larger than initially estimated by the Bureau of Labor Statistics. The Leisure & Hospitality sector had the largest percentage losses (-28.8%), followed by Retail Trade (-8.4%) and Other Services (-8.4%); these sectors also had the largest revisions and their losses early in the pandemic were underestimated. Of the sub-state areas, Suburban Maryland had the largest decrease in jobs, declining by 7.5 percent (-76,300 jobs) in 2020. The number of jobs in the District of Columbia decreased by 6.3 percent (-50,000 jobs), while jobs in Northern Virginia decreased by 4.6 percent (-69,700 jobs) in 2020. As of January 2021, the region had recovered about 41 percent of the jobs lost in April 2020, when the losses were largest. While the region ranked fourth of the 15largest employment metros in terms of jobs losses between January 2020 and January 2021, the region was the ninth most recovered (seventh least recovered) and the region’s recovery has been modest relative to both its peers and the national average.
Jobs in the Washington Region
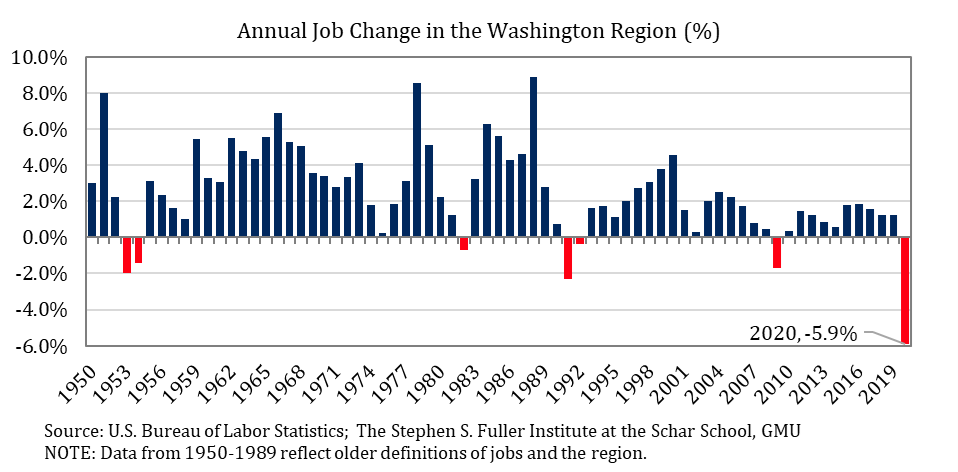
In 2020, the Washington region lost 197,000 jobs, a decline of -5.9 percent. The initial estimate was a loss of 157,700 jobs (-4.7%), which was revised downwards by 39,300 jobs (-1.2 percentage points) with the release on March 15, 2021. This is the largest annual loss for the region, both in absolute and percentage terms, in the 71 years for which this data has been tracked.
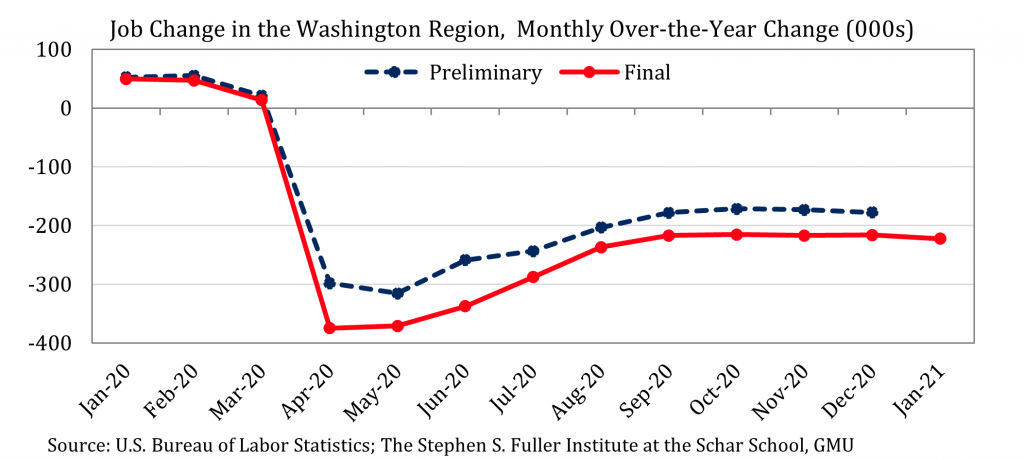
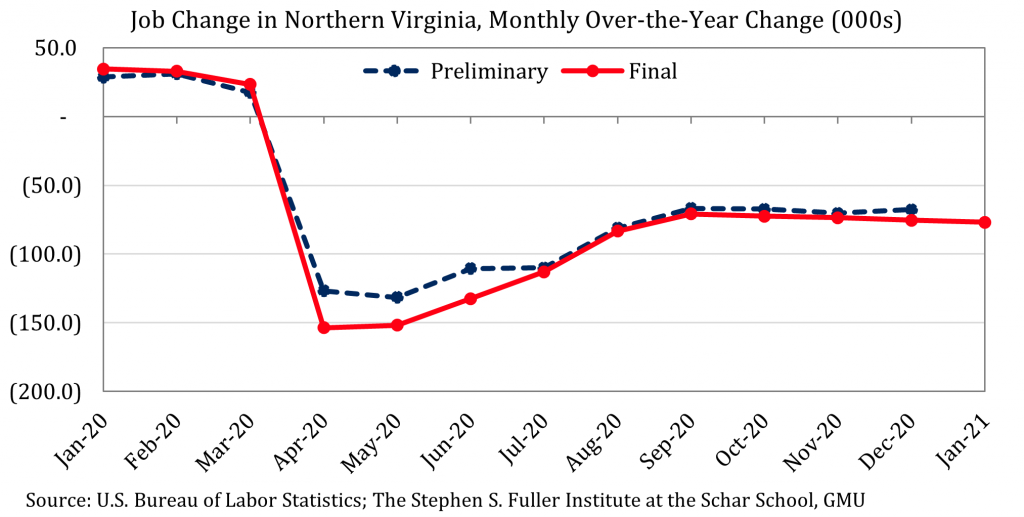
The annual decline understates the losses that occurred during the pandemic. At its peak in April, the region lost 375,000 jobs (-11.2%). This decline was about 76,700 jobs more than initially estimated and the effect of the pandemic in the early months was significantly underestimated when these data were first released. In May, the region’s jobs losses stabilized and the monthly over-the-year change was 371,200 (-11.1%), a loss that was 55,500 jobs larger than initially reported. In June, the region’s recovery began and the region’s losses compared to 2019 moderated to -337,600 (-10.0%); the initial estimate was for a loss of 258,800 jobs and the revised data show a loss that was 78,800 jobs larger. For the rest of the recovery, the number of jobs in the Washington region was revised downwards an average of 40,500 and the overall pattern was substantially unchanged.
The region’s jobs recovery was strongest in the summer months and the rate of recovery moderated in September and October. The jobs base was most recovered in October 2020, when the region had recovered about 43 percent of all the jobs lost in April. During the next three months, the recovery faltered and the region’s economy weakened. As of January 2021, the region had recovered about 41 percent of the jobs lost in April 2020. Compared to January 2020, the region had 222,500 (-6.7%) fewer jobs and this monthly over-the-year percentage decline was nearly twice (+71.4%) as large as any other since 1949, even with the improvement since April.
Compared to the 2008 and 1990 recessions, the job losses that occurred during the pandemic were nearly four times larger at its peak. Even with the recovery through January, the losses remained more than twice as large as the losses during the prior two recession. Additionally, the speed at which these losses occurred was unprecedented. During the 2008 Recession, jobs in the Washington region reached their trough after 18 months of declines; during the 1990 Recession, it took 25 months. During the pandemic, the losses were largest after just two months of declines.
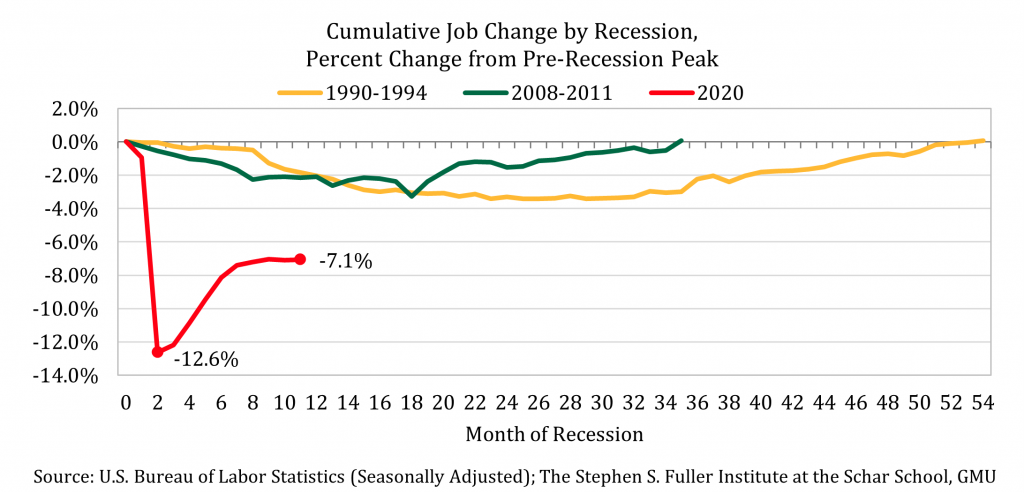
In comparison to these prior recessions, the recovery through January 2021 has also followed a different pattern. Both the 2008 and 1990 recessions followed a “U” pattern, with the losses and the gains occurring symmetrically. The 2020 recession and recovery through January 2021 has followed a “swoosh” or “ladle” pattern: a sharp two-month decline, followed by sharp five-month improvement, followed by a four-month plateau. The plateau was largely the result of the second local wave of COVID-19 and the onset of colder weather that discouraged outdoor activities. The rate of recovery will likely improve again in March and April, now that new daily COVID-19 cases have peaked and outdoor activities will resume. Going forward, the rate of recovery and its trajectory will primarily depend on the vaccination rates in the Washington region, which are likely to increase incrementally, slowing the rate of recovery after the initial spring rebound.
Jobs by Sector
Every major sector had losses in 2020, except the Federal Government, which was bolstered by temporary hiring for the Decennial Census. Still, federal jobs accounted for 10.9 percent of all jobs in 2019, prior to the pandemic, and this industry was the least affected by the pandemic, on net. One key sub-sector also had gains: Professional, Technical, & Scientific Services in the Professional & Business Service sector increased by 0.7 percent. This sub-sector accounted for 15.8 percent of all jobs in 2019 and is larger than all other major sectors in the region. Overall, more than one-quarter (26.7%) of the region’s jobs base in 2020 continued to add jobs in 2020. Three sectors had the largest percentage declines: Leisure & Hospitality, Retail Trade, and Other Services. These sectors accounted for 69.5 percent of all the jobs lost in 2020, despite being 24.4 percent of the jobs base in 2019. Combined, these sectors lost 137,000 jobs for a decrease of 16.7 percent, and their recession and recovery continues to disproportionately affect the overall pattern of total job change in the region. These three sectors also accounted for 93.8 percent of the net revision to the jobs data and their pandemic-induced losses were initially underestimated.
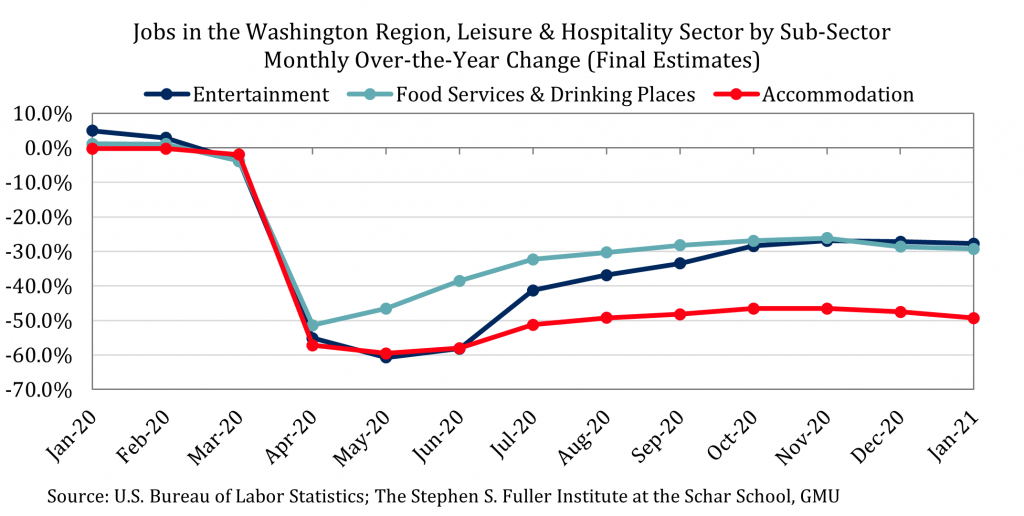
The Leisure & Hospitality sector had the largest losses of any sector, both in total number of jobs lost and as measured as a percentage of the industry. In 2020, this sector lost 97,100 jobs for a decrease of 28.8 percent, a decline that was 15,700 jobs larger than initially reported. During the pandemic, this sector had a large variation in performance. Its peak losses occurred in April and the number of jobs decreased by 177,000 (-52.7%) compared to April 2019. This sector’s recovery began in May and, by November, had recovered about 45 percent of the jobs. In December and January, the Leisure & Hospitality sector’s recovery faltered and, as of January 2021, this sector was about 42 percent recovered.
The Leisure & Hospitality sector consists of three sub-sectors: Accommodation, Food Service & Drinking Places, and Entertainment. Each of these sub-sectors had their peak losses in either April or May and lost more than one-half of their jobs base compared to 2019: Entertainment (-60.7% in May), Accommodation (-59.5% in May), and Food Services (-51.4% in April). Similarly, each of these sub-sectors was the most recovered in November and conditions in these sub-sectors deteriorated during December 2020 and January 2021. The Entertainment sub-sector was the most improved through November and had the smallest losses in December and January; as of January, this sub-sector had recovered about 54 percent of the jobs lost. The Food Service & Drinking Places sub-sector had recovered about 49 percent of the jobs lost as of November but had the largest relative decline in the following months. As of January, this sub-sector was 43 percent recovered. The Accommodation sector has had the slowest recovery and had recovered about 17 percent of its jobs as of January 2021.
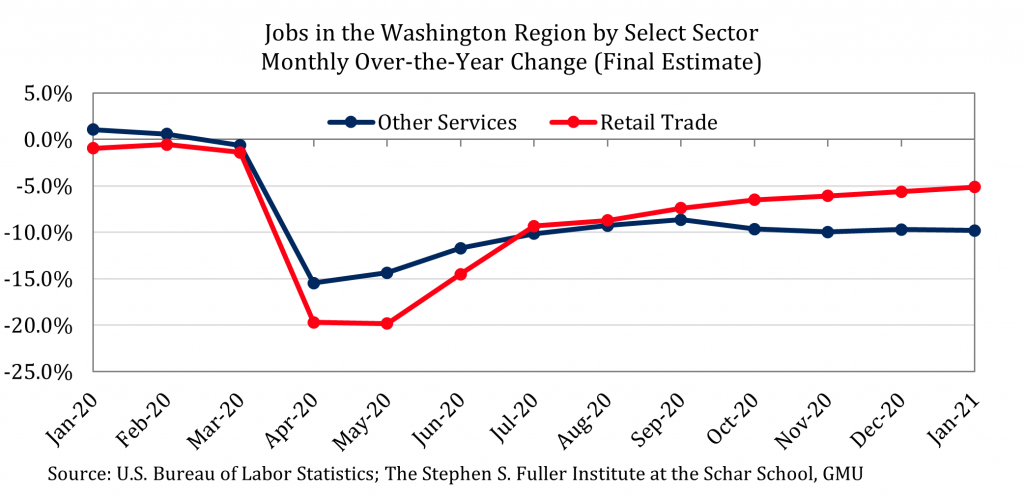
The Retail sector had the second largest percentage loss and decreased by 8.4 percent in 2020, a decline of 22,700 jobs. This decrease is 10,500 more than initially reported. The losses peaked in May 2020 when this sector lost 53,300 jobs (-19.8%) compared to May 2019. Since May, the number of jobs in this sector has increased each month and the sector was about 74 percent recovered as of January 2021, the most of any sector with losses.
The Other Services sector, which includes personal care services, repair and maintenance, and associations, lost 17,200 jobs (-8.2%), 10,800 more jobs than were initially reported. Its peak losses occurred in April, with a decline of 32,400 jobs (-15.5%) compared to April 2019. This sector recovered during the summer months and, in September, had regained about 44 percent of the jobs initially lost. However, these gains partially reversed during the fall and winter and this sector was about 37 percent recovered as of January 2021.
The sectors that had the largest losses in 2020 also had the lowest average wages in 2019 prior to the pandemic. The average wage of a Leisure & Hospitality job was $29,765 in 2019 and was the lowest average of all major sectors. Retail Trade had the second lowest average wage, at $35,930, while Other Services ranked sixth, at $71,790. The average wage of the jobs lost in 2020 was $46,600, a wage that was 41.0 percent lower than the average of all jobs. In contrast, the average wage of a Professional, Technical, & Scientific Service sub-sector job was $128,430 in 2019, ranking first, and the average wage of a Federal Government job was $117,995, ranking third. In combination, the average wage of a job added in 2020 in these sectors was $121,300, an average that was 53.5 percent larger than that for all jobs. In other words, the Washington region disproportionately lost low-wage jobs during the pandemic while key, large sectors continued to grow, albeit modestly.
Jobs by Sub-State Area
Each of the sub-state areas had significant losses in 2020 and the preliminary releases underestimated the declines that occurred during the pandemic for each. Suburban Maryland has had the largest percentage losses for most of the pandemic. The District and Northern Virginia had smaller initial declines, but the District’s recovery lagged that in Northern Virginia and was the least recovered as of January 2021.
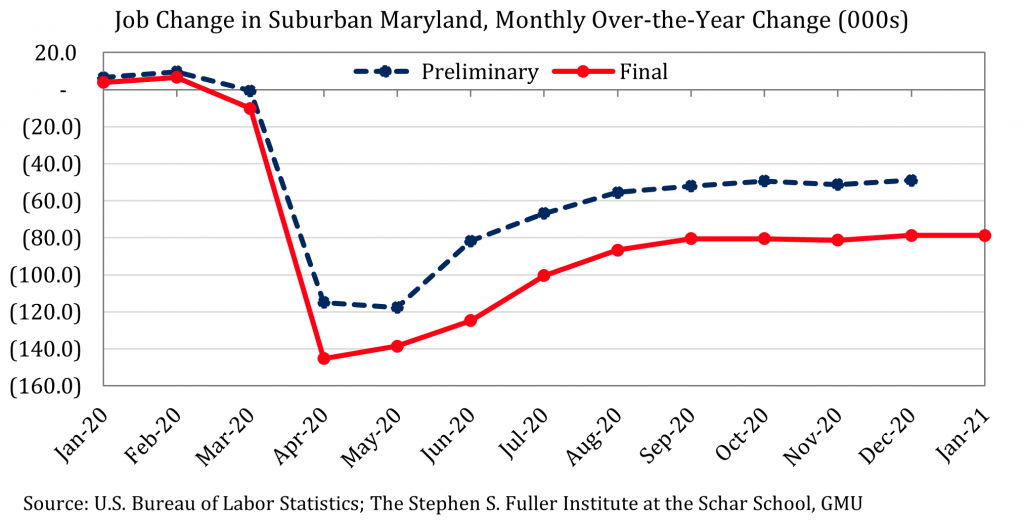
In 2020, Suburban Maryland lost 76,300 jobs for a decline of 7.5 percent, the largest percent decline of the sub-state areas. As in prior years, Suburban Maryland also had the largest downward revision; the preliminary data estimated a loss of 51,900 jobs (-5.1%), which was revised downwards by 24,400 jobs (-2.4 percentage points). Three sectors accounted for 62.6 percent of the losses in 2020: Leisure & Hospitality, Education & Health Services, and Retail Trade. The losses in the Education & Health sector were concentrated in the Nursing & Residential Care and Social Assistance sub-sectors. Overall, Suburban Maryland’s jobs losses peaked in April and the sub-state area lost 145,300 jobs (-14.2%) compared to April 2019. Similar to the region, the recovery was strongest in the summer and plateaued in the fall and winter months. As of January 2021, Suburban Maryland had recovered about 46 percent of the jobs lost in April.
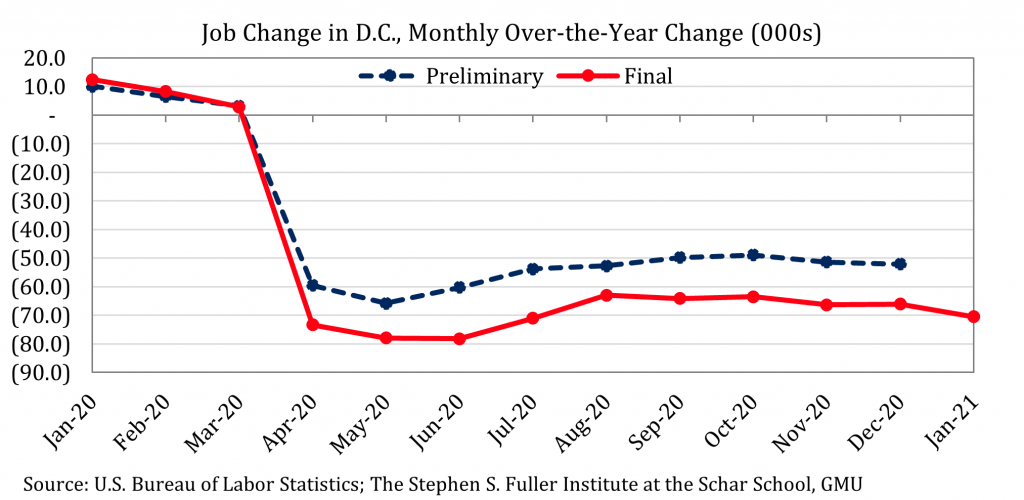
In 2020, the District lost 50,000 jobs (-6.3%), a loss that was 10,500 jobs (-1.3 percentage points) greater than initially estimated. The three sectors with the largest percentage losses were Leisure & Hospitality, Manufacturing, and Transportation & Utilities. Regionally, Transportation & Utilities had modest losses and the District’s decline likely reflects the large decrease in transportation demand from commuters. Job losses in the District peaked in June, decreasing by 78,200 jobs (-9.8%) on a monthly over-the-year basis. By August, the District had recovered about 19 percent of these lost jobs, but the recovery faltered and about one-half of the initial gains were lost. As of January 2021, the District had recovered about 10 percent of the jobs lost in June. Of the sub-state areas, the District is the least recovered primarily due to its Leisure & Hospitality sector, which had larger initial losses and has had a slower and less consistent recovery compared to the rest of the region.
Northern Virginia had the smallest losses in 2020 of the sub-state areas. Northern Virginia lost 69,700 jobs (-4.6%) in 2020, a loss that was 6,800 larger than initially estimated. On a percentage basis, the largest losses in Northern Virginia were in the Leisure & Hospitality, Other Services, and Retail Trade sectors; these sectors accounted for 78.5 percent of all losses in Northern Virginia. During the pandemic, the peak jobs losses occurred in April and Northern Virginia lost 153,700 jobs (-10.2%) compared to 2019. By September, about 54 percent of the jobs lost had been recovered before the recovery stagnated. As of January 2021, Northern Virginia’s jobs base was about 50 percent recovered, the most of any sub-state area.
Jobs by Metro Area
Of the 15 largest employment metros, the Washington region ranked 6th in terms of job change in 2020. Altogether, the 2020 rank for the region reflects the average performance of the region for the year and this rank was not consistent during each month of 2020. The region lagged its peer metros during two main periods in 2020. The Washington region ranked 10th and 11th, respectively, in terms of growth prior to the pandemic in January and February. The region also underperformed during June and July when it ranked seventh, as many metros had re-opened and had not yet experienced their first local waves of COVID-19. When the jobs losses were largest in April, the Washington region’s monthly over-the-year decline of 11.2 percent was the fifth smallest decline. Similarly, between January 2020 and January 2021, the Washington region lost 6.7 percent of its jobs and had the fourth smallest decline, behind Dallas (-3.0%), Phoenix (-3.8%) and Atlanta (-5.6%).
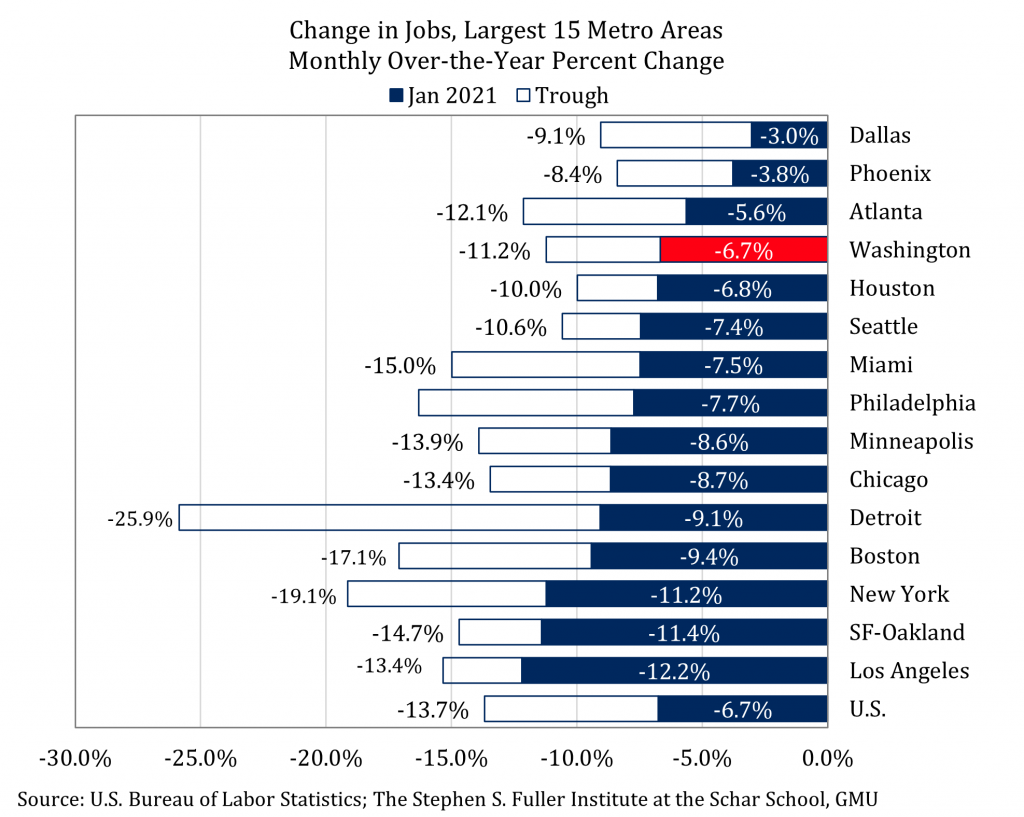
Of the largest metros, the Dallas metro was the most recovered in January 2021 compared to its trough and had regained about 66 percent of the jobs that had been lost. The Dallas metro also had the second smallest peak losses, behind the Phoenix metro. The second most recovered metro was Detroit, which lost 25.9 percent of all its jobs in April 2020 compared to April 2019. As of January, Detroit had recovered about 65 percent of its lost jobs, but remains 9.1 percent below its January 2020 level. The third most recovered metro was Phoenix, which has ranked first or second during each month of the pandemic. The Washington region was the ninth most recovered metro. While the Washington region had a relatively mild trough and continues to have smaller losses compared to other metros, the rate of recovery has been in the middle of its peer metros and has modestly lagged the national average. This slower recovery pattern relative to the other largest metros and the nation is likely to continue in the upcoming months.
About These Data
All data are from the U.S. Bureau of Labor Statistics (Current Employment Statistics). These data are released monthly and re-benchmarked in March. The preliminary data are the data as of January 26, 2021 and were initially released between March 2020 and January 2021. The revised or re-benchmarked data were released March 15, 2021.
A Note on the National Estimates
BLS estimates each geography separately, including the national estimate and estimates for each of the states and metro areas. These estimates are not forced to sum to larger geographies and occasionally differences arise that, while frequently within the margins of error for these surveys, can alter the relative performance trends. In the March 15, 2021 release, the total number of jobs that were estimated at the state-level (i.e. the sum of the state totals) reflected a slower recovery than the national estimate. In January 2021, the national estimate reflects a loss of 9.1 million jobs (-6.1%) compared to January 2020; however, the total loss of each of the states totals 10.2 million jobs (-6.7%) (not seasonally adjusted changes). This magnitude of difference between these estimates has occurred for each monthly over-the-year change since June 2020 and alters the recovery pattern. When comparing the national trends to local trends, either by state or metro area, the Stephen S. Fuller Institute will use a national estimate that is derived from the state-level estimates (the sum of the states), as these are the jobs that are allocated locally.