
Download the “Jobs in the Washington Region Recover to Pre-Pandemic Levels” report as a PDF>>
The Washington region added 35,300 jobs in 2018 based on data released yesterday from the U.S. Bureau of Labor Statistics (BLS), 16,800 fewer jobs than indicated by the preliminary releases. According to the most recent data, job growth was significantly weaker during the second half of the year and the gain between the fourth quarter 2017 and the fourth quarter 2018 was the smallest quarterly increase since 2014.
In the Washington region, job growth during the second half of 2018 was significantly revised downward, resulting in the less job growth than initially reported for the year. The largest revision was to the number of jobs gained between July 2017 and July 2018. The preliminary estimate of job growth during this period was +78,700. With this release, job growth during this period was just +39,500, a revision of -37,200.
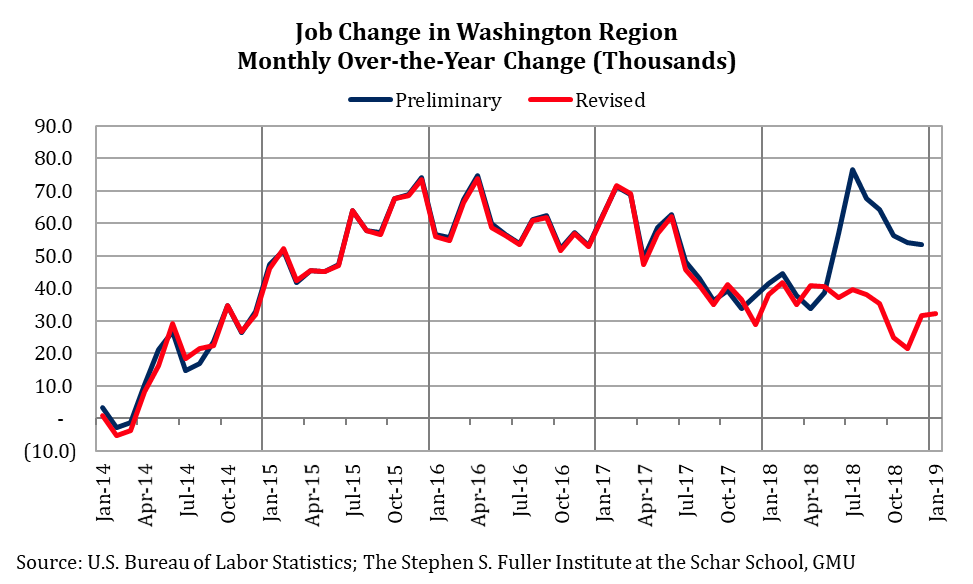
Even excluding the July revision, the average revision for the second half of the year was -27,500 jobs and was large enough to change the trajectory of gains over the course of the year. Prior to the revision, job growth was relatively consistent in the first half of 2018, accelerated sharply during the third quarter and remained strong in the fourth quarter. According to the most recent data, job gains were relatively consistent during the first three quarters of the year, adding an average of 38,000 jobs on a monthly over-the-year basis. Job growth decelerated in the fourth quarter and the region added an average of 25,900 jobs compared to the fourth quarter in 2017, the smallest quarterly over-the-year change in four years. The monthly over-the-year gains stabilized in December 2018 (+31,500) and January 2019 (+32,100), but the overall trend now reflects a moderating pattern of gains that began in mid-2017.
Job Revisions by Sub-State Area
As with the revisions in March 2017 and March 2018, the largest revision in March 2019 was in Suburban Maryland: in 2018, Suburban Maryland added just 3,200 jobs instead of the 9,400 that were initially reported, a decrease of 66 percent. The District had the largest upward revision and added 3,000 more jobs (+64%) in 2018 than previously reported according to these revised data. Northern Virginia also had stronger job growth in 2018 than the preliminary releases suggested and was revised upwards by 27 percent.
Unlike the prior years’ revisions, the largest component of the revision was not attributable to a sub-state area. BLS estimates each of the sub-state areas and the Washington region separately and the totals of each geography are not forced to sum exactly. The difference between the sum of the sub-state areas and the regional estimate, the estimation residual, is not reflected in any geography. This estimation residual is typically small, even prior to the March revisions, and relatively consistent during the year with the occasional exception of summer months that are more sensitive to seasonal changes.
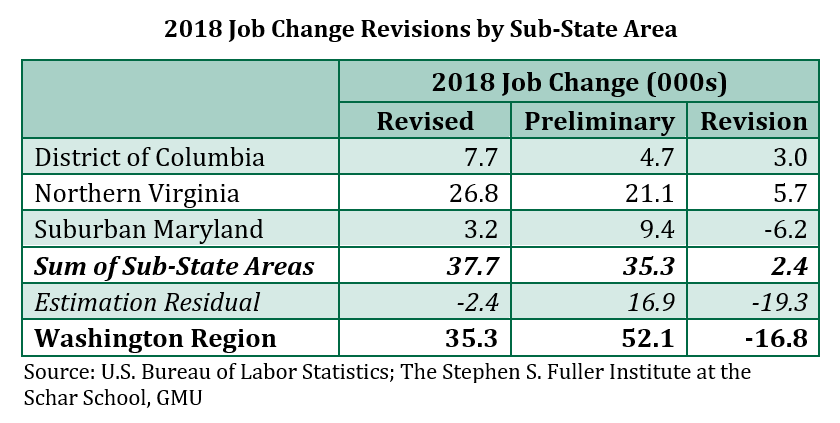
During the second half of 2018, the estimation residual of the preliminary data was significantly larger than the historic average. Instead of revising the estimates by relatively equal amounts, as occurred in the March 2017 revisions, the regional estimate was revised downward so that it more closely aligned with the sum of the sub-state areas. Generally, larger geographies have smaller margins of error and have more precise estimates, especially when the sample coverage is larger as is the case with the regional estimate.[1] But these revised estimates indicate that the preliminary regional totals were less accurate than the sum of the sub-state areas, which may also be an issue later in 2019.
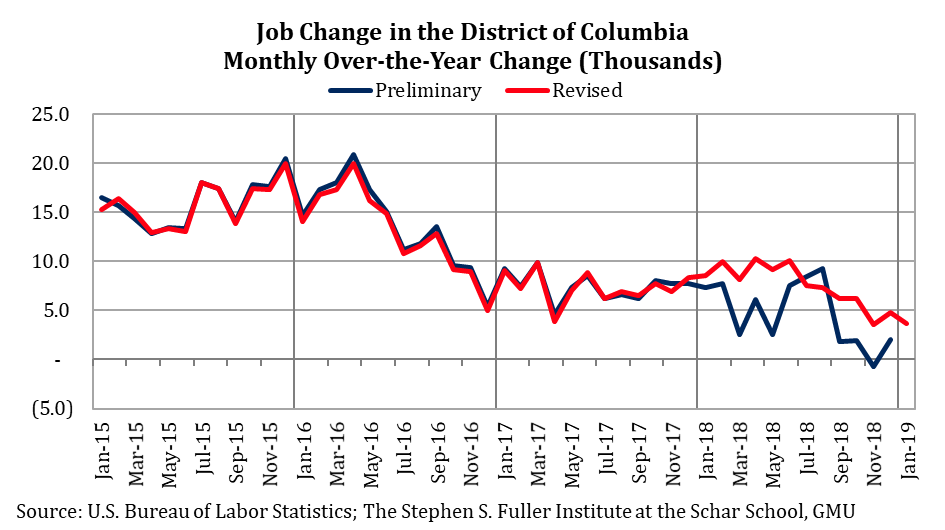
District of Columbia
The District of Columbia added 7,700 jobs in 2018, about 3,000 more jobs than the preliminary releases suggested. The monthly over-the-year changes for all months except July and August were revised upward and the majority of the revision was to the Education & Health Services sector. Altogether, the revised jobs data showed a modest improvement in job growth compared to 2017. However, growth appears to have peaked during the summer of 2018 and gains have moderated since.
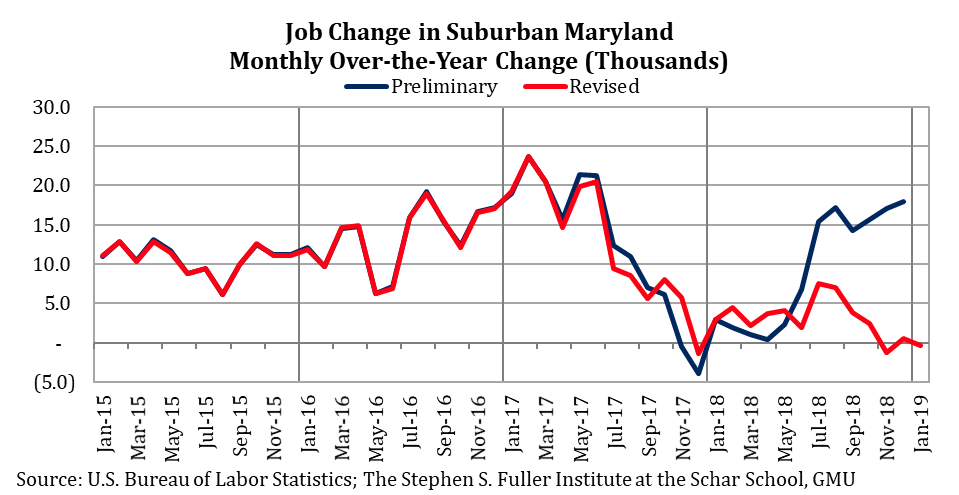
Suburban Maryland
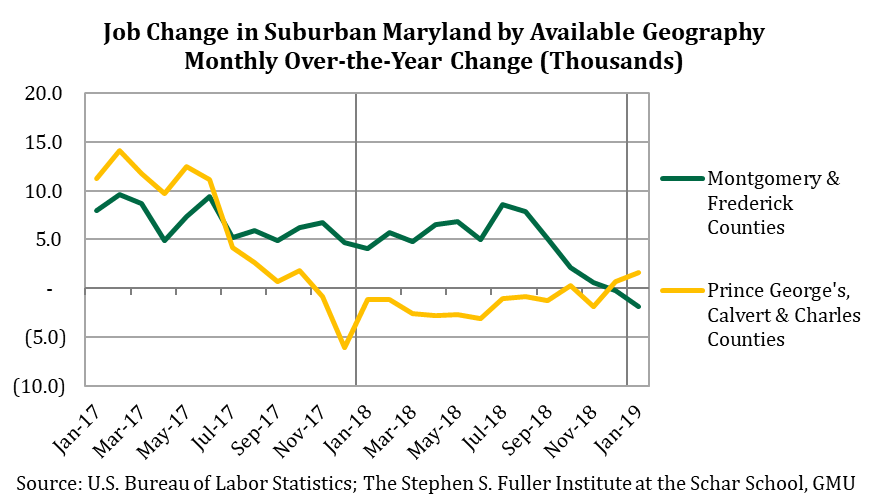
As with the revisions in March 2017 and March 2018, job growth in Suburban Maryland was significantly revised down: in 2018, Suburban Maryland added just 3,200 jobs instead of the 9,400 that were reported by the preliminary releases. The largest revisions were to the Construction and Retail sectors, which both lost jobs in 2018 according to the revised data.
The revisions were most acute during the second half of 2018 and eliminated the accelerated growth trajectory that was reflected by the preliminary data. Instead, Suburban Maryland followed a pattern similar to the region, overall: relatively stable but modest gains during the first three quarters of the year followed by a deceleration in the fourth quarter. In Suburban Maryland, this deceleration resulted in monthly over-the-year job losses in both November 2018 (-1,300) and January 2019 (-300).
The largest revision was to Montgomery and Frederick counties (combined), which added 4,700 jobs in 2018 according to the most recent data, down from 9,800 in the preliminary estimate. This is the smallest gain since 2010 and the downward trend in growth extended into 2019, with a decrease of 1,900 between January 2018 and January 2019.
Prince George’s, Calvert, and Charles counties (combined) had 1,500 fewer jobs in 2018 compared to 2017, 1,200 fewer than suggested by the preliminary data. This is the first annual decrease since 2011, although the modest uptick in growth that occurred in December 2018 and January 2019 may indicate that the losses have stabilized.
Northern Virginia
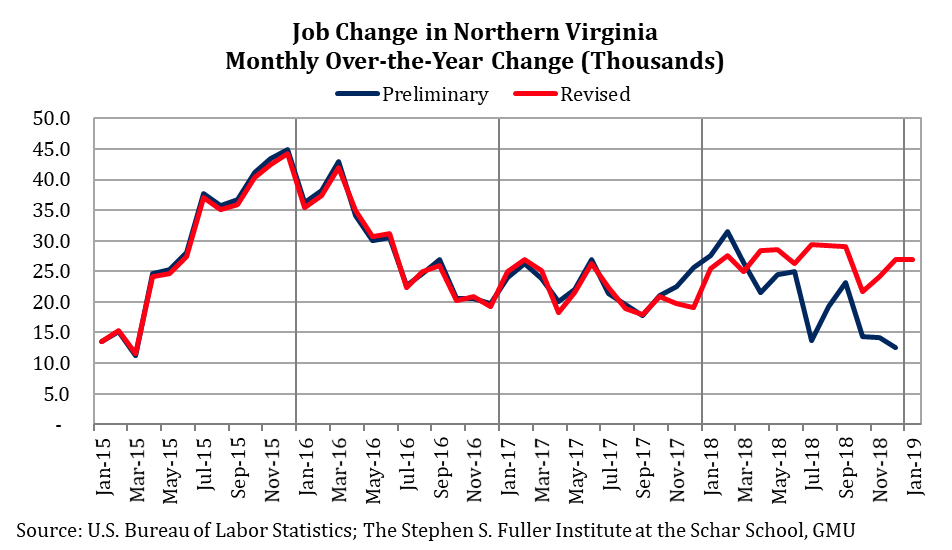
The number of jobs in Northern Virginia increased by 26,800 in 2018, or by 5,700 more jobs than in the preliminary releases. The largest revision was to State & Local Government jobs, which decreased by 6,400 according to the preliminary releases but were revised upwards to a gain of 3,600 jobs. This large, upwards revision was offset by smaller, downward revisions primarily to the Construction and Leisure & Hospitality sectors. The job growth trend was also revised modestly so that growth was more consistent over the year.
About These Data
All data are from the U.S. Bureau of Labor Statistics (Current Employment Statistics). These data are released monthly and re-benchmarked in March. The preliminary data are the data as of January 18, 2019 and were initially released between March 2017 and January 2018. The revised or re-benchmarked data were released March 11, 2019.
[1] See Table 2 for the standard errors and sample based percentages by geography.