
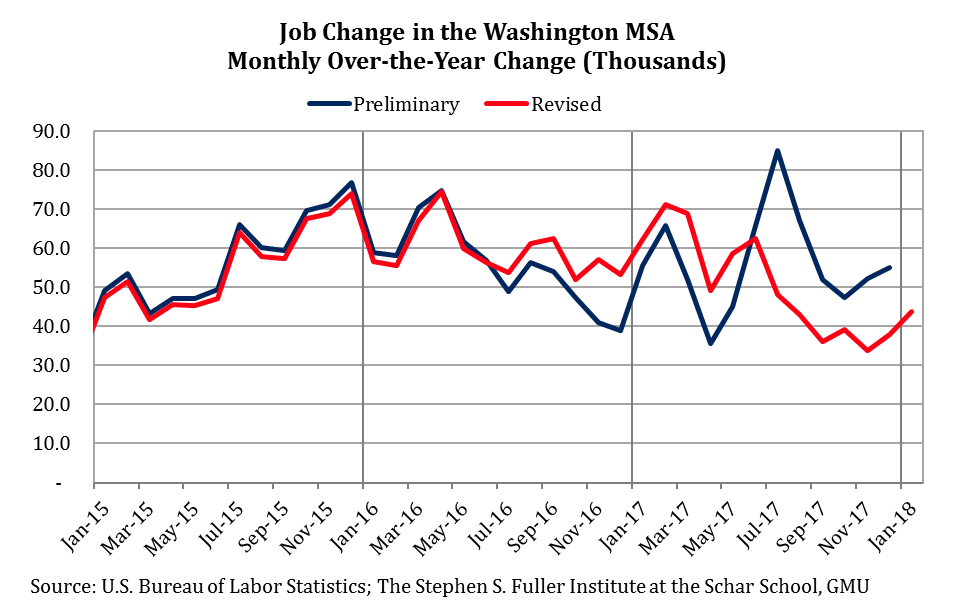
The Washington region added 50,900 jobs between 2016 and 2017 based on data released today from the U.S. Bureau of Labor Statistics (BLS), 5,600 fewer jobs than indicated by the preliminary release. The major revisions include
- stronger job growth in the Other Services sector, which led the gains in 2017,
- weaker job growth in the Professional & Business Services, Retail Trade, Leisure & Hospitality, and Education & Health sectors than initially reported,
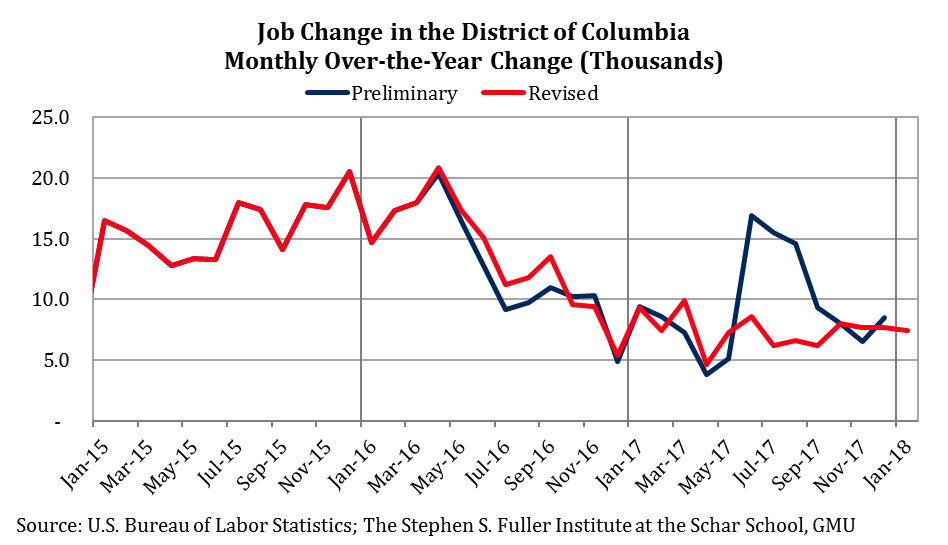
- downward revisions to growth during the summer months in the District of Columbia,
- weaker growth in Suburban Maryland, including job decreases at the end of 2017, and
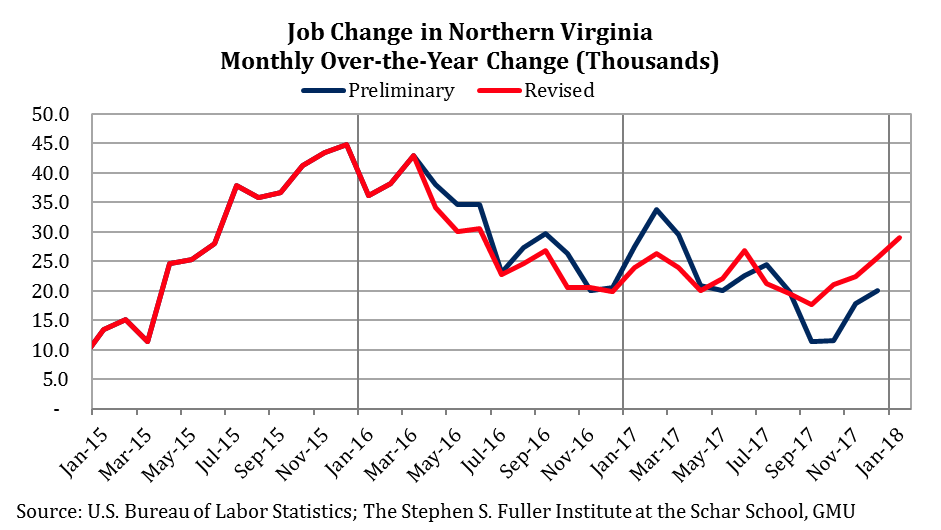
- modest upward revisions to job growth in Northern Virginia.
In the Washington region, job growth during the second half of 2016 through the first half 2017 was revised upwards by an average of 10,000 jobs. However, the gains during the second half of 2017 had significant downward revisions, resulting in the less job growth than initially reported for the year. The largest revision was to the number of jobs gained between July 2016 and July 2017. Job growth during this period was initially estimated to be +85,000. With this release, job growth during that period was just +48,100, a revision of -36,900. The revisions for the remaining months in 2017 average -16,700.
By sector, the largest increase between 2016 and 2017 was in Other Services (+11,400), which includes personal services and business/civic associations. This sector also had the largest upward revision: the preliminary estimate showed an increase of 2,300 and the current release revised that figure upwards by 9,100 jobs.
The largest downward revision was to the Professional & Business Services sector, which gained 10,400 jobs between 2016 and 2017 according to the revised data; preliminary data indicated it was on track to increase by 16,300 jobs. Despite the revision, this sector had the second largest gain in 2017, behind Other Services.
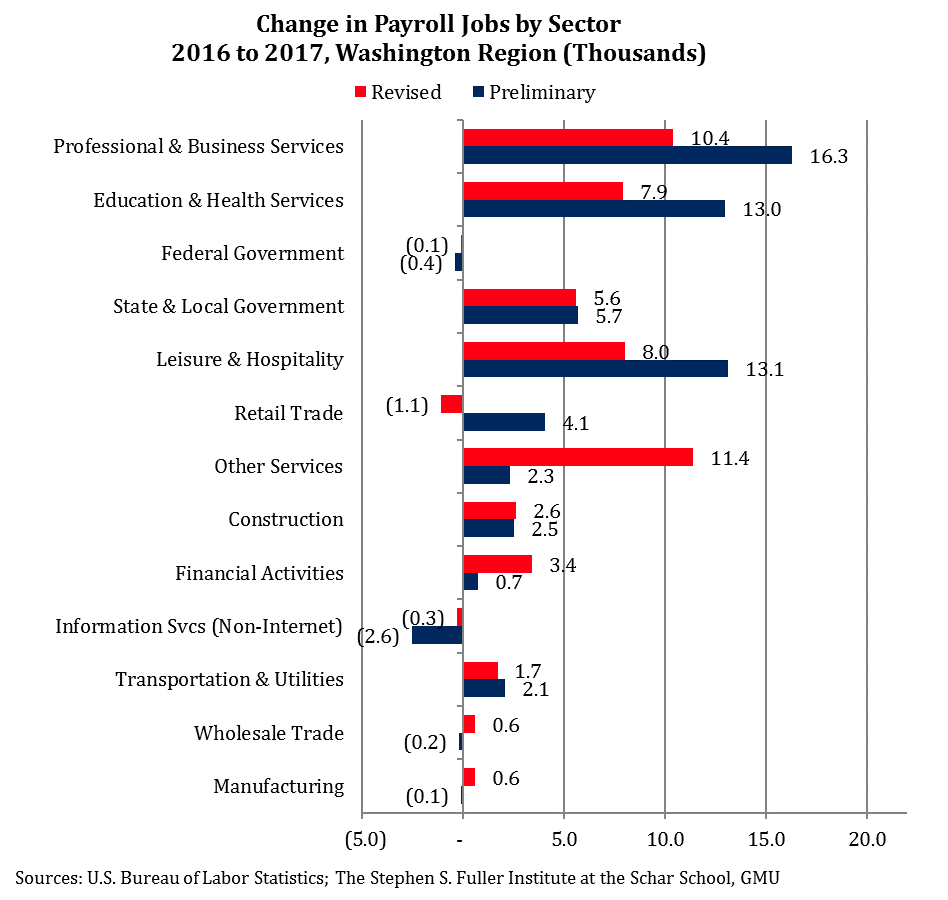
Three other sectors also had significant downward revisions: Retail Trade, Leisure & Hospitality, and Education & Health. Between 2016 and 2017, the number of jobs in the Retail Trade sector decreased by 1,100; prior to the revisions, this sector gained an estimated 4,100 jobs. The decrease in Retail Trade jobs in 2017 marked the first decline since the Recession in 2009.
Leisure & Hospitality job growth in 2017 was also revised down to +8,000 jobs from the preliminary release of +13,100 jobs. Even with this revision, this sector had the third largest gain. Education & Health Services had the fourth largest gain, but also had a significant downward revision compared to the preliminary release. Based on the preliminary data, the Education & Health Services sector was on track to add 13,000 jobs. After these revisions, this sector increased by just 7,900 jobs.
Job Revisions by Sub-State Area
Of the sub-state areas, Suburban Maryland had the largest downward revisions and gains were about 57 percent of what was reported in the preliminary release for 2017. The job growth in the District was also revised downward to about 79 percent of the gains reported in the preliminary release for 2017. Northern Virginia had modestly stronger growth adding about 5 percent more jobs than initially reported for 2017.
District of Columbia
The District of Columbia added 7,500 jobs in 2017, about 2,000 fewer jobs than the preliminary releases suggested. The downward revision occurred exclusively during the summer months and was the result of revisions to the Leisure & Hospitality and Education & Health Services sectors. Altogether, the revised jobs data showed consistent growth for the District in 2017, but gains were subdued compared to the increases in 2015 and 2016.
Suburban Maryland
Suburban Maryland had significant downward revisions similar to those that have occurred in prior years (see our analysis of last year’s revisions). In 2017, Suburban Maryland gained 12,800 jobs, which is 9,600 fewer jobs than reported by the preliminary release. This weaker growth was largely a result of a downward revision to State & Local Government. While this sector accounted for about one-half of the total revision, the Retail Trade and Leisure & Hospitality sectors also had less growth than initially reported.
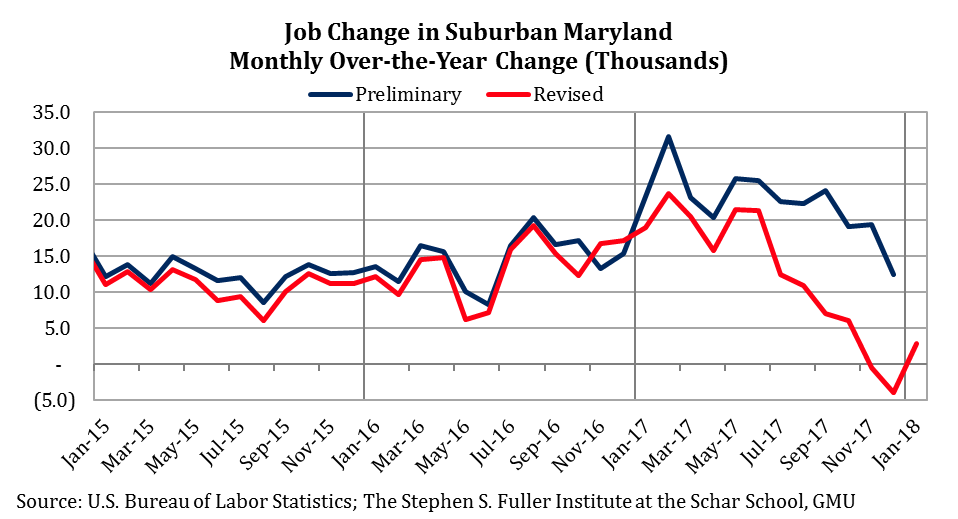
The overall trend of job growth was also revised. Job gains slowed during the second half of 2017, and the year ended with two consecutive year-over-year decreases. The number of jobs in Suburban Maryland decreased by 500 between November 2016 and November 2017 and decreased by 3,900 between December 2016 and December 2017. These declines were the first since 2011.
Northern Virginia
The number of jobs in Northern Virginia increased by 22,600 between 2016 and 2017, about 1,000 more jobs than in the preliminary release. The largest revision occurred in February, which was revised to +26,300 from +33,800 as a result of weaker growth in the Professional & Business Service sector. Growth in this sector was also revised downward for year but was offset by upward revisions to the Information Services (excluding internet) sector. The job growth trend was also revised modestly, showing an acceleration in growth during Fall 2017 which continued into January 2018 (+29,100).
About These Data
All data are from the U.S. Bureau of Labor Statistics (Current Employment Statistics). These data are released monthly and re-benchmarked in March. The preliminary data are the data as of January 23, 2018 and were initially released between March 2017 and January 2018. The revised or re-benchmarked data were released March 12, 2018.