This is the first of two blogs covering this report. This blog examines the one-year changes in 25-34 year olds between 2010 and 2017. The second blog post examines the five-year change in the oldest members of the Millennial generation, those born between 1983 and 1992, between 2012 and 2017.
The number of 25-34 year olds in the Washington region increased significantly in 2011. These gains moderated in the following years and, in 2015, the region was home to fewer 25-34 year olds compared to 2014. This slowing trend reversed in both 2016 and 2017, and the increase in 2017 was the largest since 2013. Despite the strong gain relative to prior years, the Washington region’s growth continued to lag that in the U.S. and the other large metros.
The change in 25-34 year olds were driven by different demographic groups. The losses that occurred around 2015 were driven by 25-29 year olds, women, and Hispanic and white, non-Hispanic people. During this period, the region had continued increases in 30-34 year olds, men, and not Hispanic people who were either Black/African American, Asian or multi-racial. The acceleration in gains in 2017 was driven by relatively large increases in 25-29 year olds and men, and a smaller decrease in white and not Hispanic people.
The Washington Region
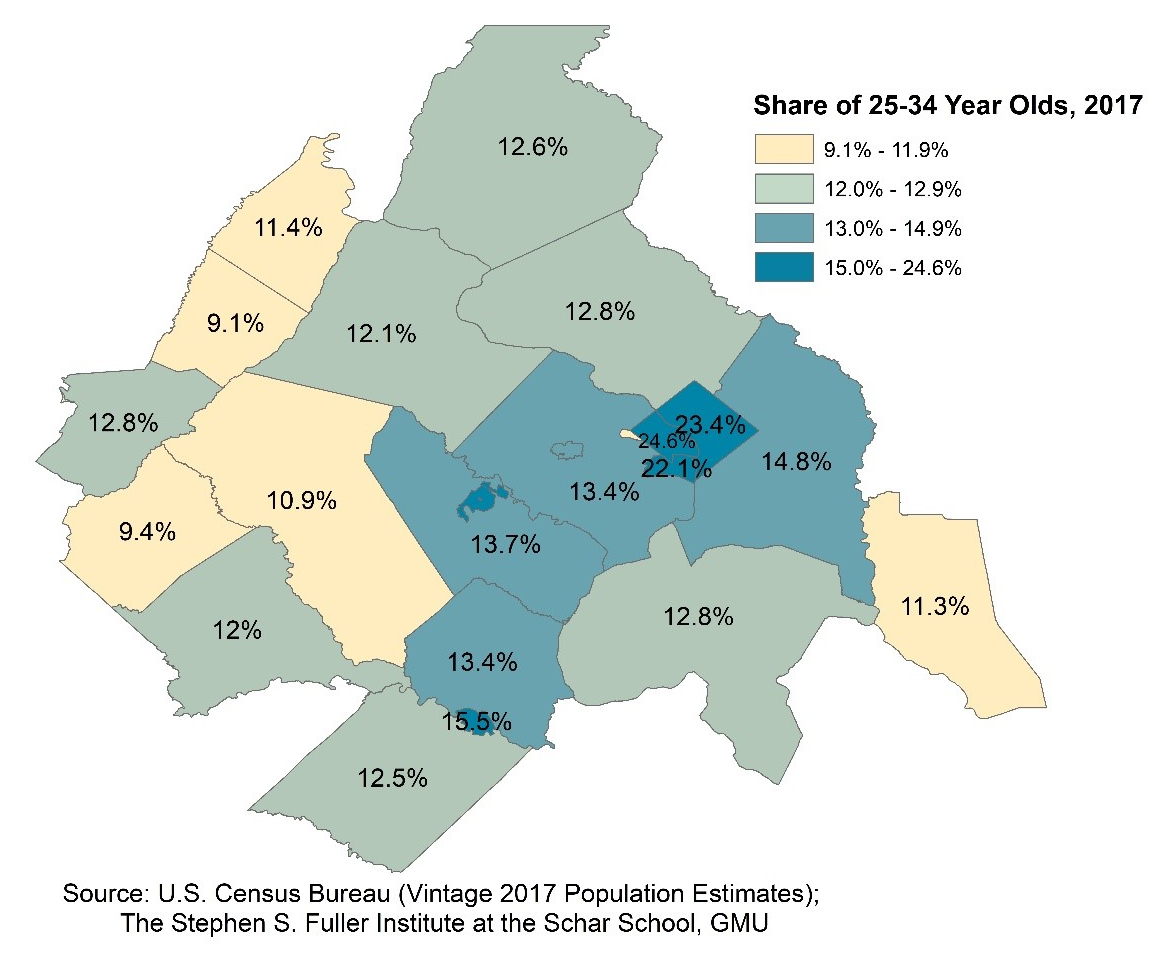
According to the newest data, the number of 25-34 year olds living in the Washington region increased 0.7 percent and by 6,190 people in 2017. While the growth in this age group lagged the total population growth (+1.1%), this is the largest gain since 2013. It also appears that the region has fully pivoted away from the slowing trend that occurred in prior years, in part due to revisions to these data.
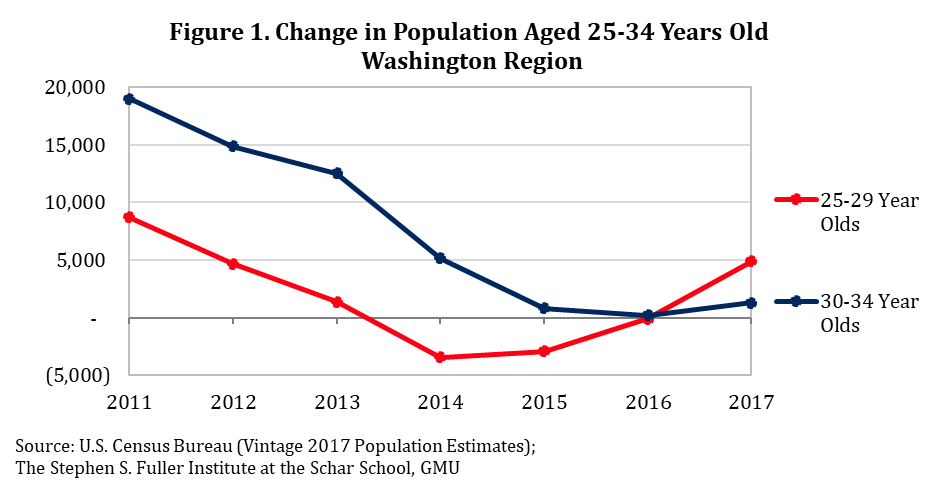
The trends differ slightly by five-year age group (Figure 1). The gains in the population aged 25-29 years old slowed between 2011 and 2013 and became negative in 2014. The loss in 2014 was the largest during this time period: -3,430 people and -0.7 percent. The losses moderated in 2015 (-2,890 people) and flattened in 2016 (-100 people). The increase of 4,900 people in 2017 was the largest since 2011 and reflects an acceleration in the upward trend from prior years.
By contrast, the region added 30-34 year olds during every year since 2010, although the gains slowed between 2011 and 2014 and flattened in 2015 (+800 people) and 2016 (+230 people). In 2017, the region added 1,295 people aged 30-34 years old. While this is the largest increase since 2014, it reflects only a modest shift from the prior two years.
The newest data have been revised from last year’s release, which showed four consecutive decreases (2013, 2014, 2015 and 2016) for the 25-29 year old age group and the two consecutive declines (2015 and 2016) for the 30-34 year old age group.
Even though the magnitude of the revisions was relatively small, they alter the overall pattern of changes for these age groups. The revised data show that the losses in both five-year age groups were somewhat smaller and reached their trough earlier. The upward revisions further indicate that both age groups are now following an upward pattern of growth.
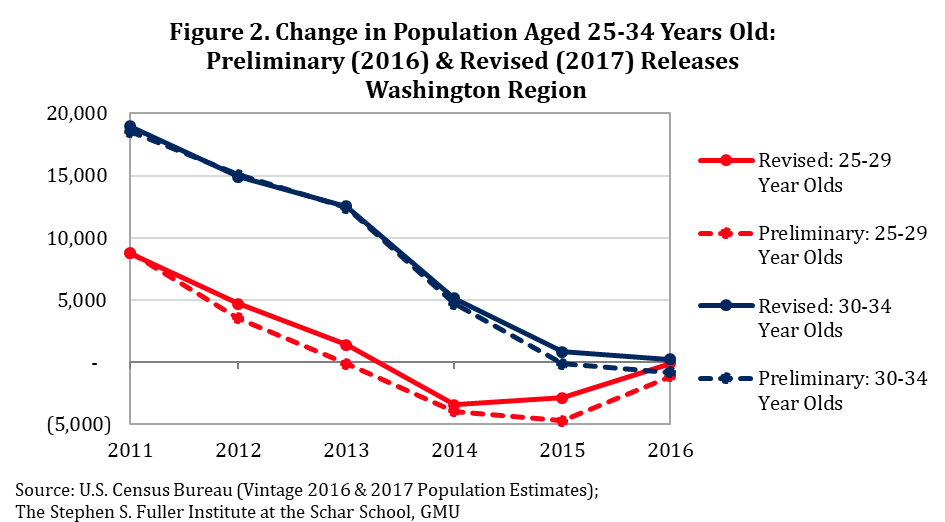
Altogether, it appears that slowing pattern of growth in 25-34 year olds that resulted in losses in 2015 has reversed. This reversal was more pronounced for 25-29 year olds and the shift for 30-34 year olds was somewhat weaker.
Change in 25-34 Year Olds: The U.S. and 15 Largest Metros
Even with this reversal from the prior years’ trend, the Washington region underperformed the growth in 25-34 year olds in both the U.S. and the other large metros in 2017.
As shown in Figure 3, the Washington region had significantly faster growth in the number of 25-34 year olds living in the region than in the nation during 2011 and 2012. In 2013, the growth in the region was only modestly larger than the nation’s and, by 2014, the region significantly underperformed the national gains in this age group. This underperformance continued in both 2015 and 2016; the nation’s annual growth in 25-34 year olds exceeded the region’s by 1.6 percentage points for both years.
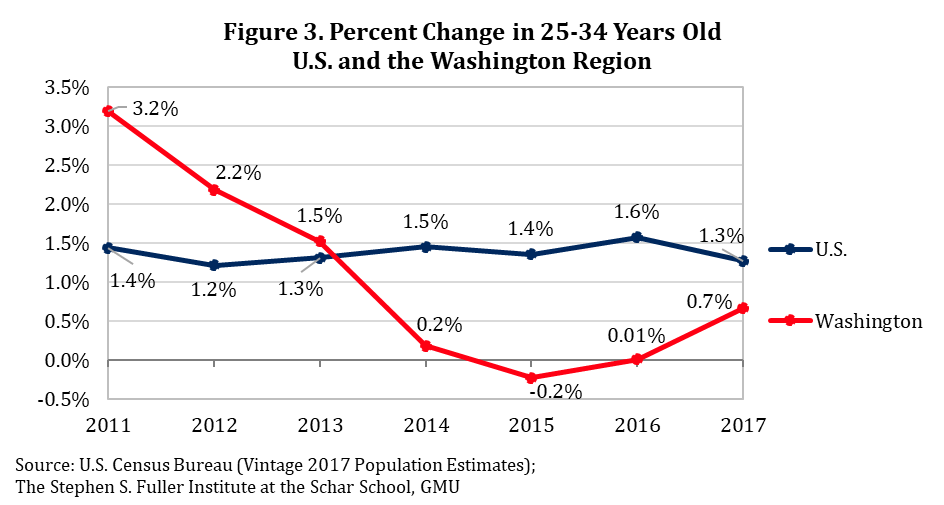
In 2017, the number of 25-34 year olds in the Washington region increased 0.7 percent compared to the national increase of 1.3 percent. While the region’s growth was only about one-half (52.3%) that of the nation’s, the region performed relatively better compared to the prior three years.
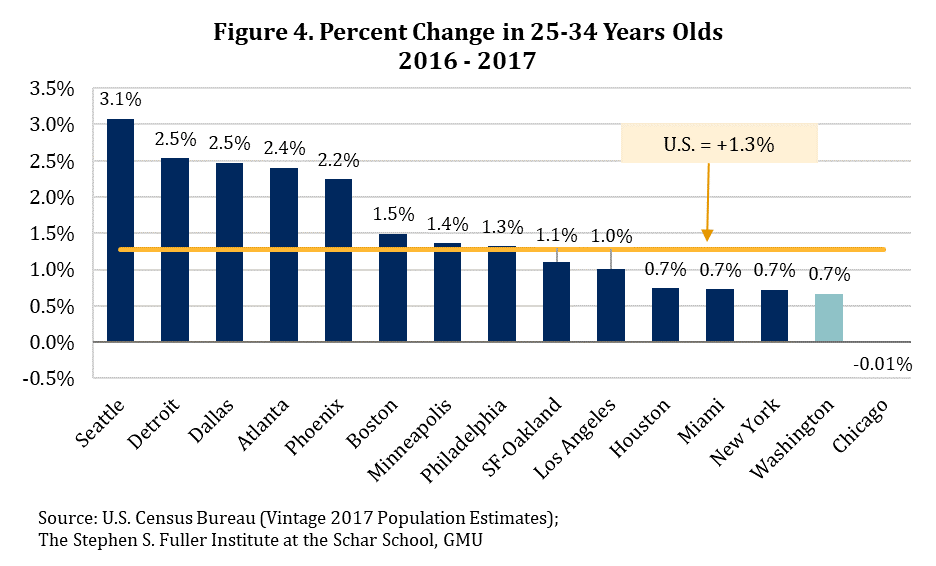
Similarly, the region continues to underperform its peer metros. The Washington region ranked 14th of the 15 largest metros in terms of growth in 2017. Chicago ranked 15th and had an absolute decline in 25-34 year olds compared to 2016. The Washington region has ranked 14th in every year between 2014 and 2017. In 2011, it ranked first.
Altogether, the number of 25-34 year olds in the region increased 7.7 percent between 2010 and 2017. Of the 15 largest metros, the Washington region had the 14th smallest seven-year growth in 25-34 year olds, in spite of the strong gains early in the period.
Additionally, this age group has fallen modestly as a share of the Washington region’s population. In 2010, 15.3 percent of all residents in the region were between 25 and 34 years old, the largest share of the largest 15 metros. In 2017, just 15.1 percent of the region’s population were in this age group. As of 2017, 25-34 year olds were more concentrated in Seattle (16.7%), San Francisco-Oakland (16.3%), and Los Angeles (15.7%) than in the Washington region.
While the Washington region had stronger gains in 25-34 year olds compared to the region’s prior performance, these gains were not large enough to improve the region’s performance relative to the other large metros.
Trends by Sex in the Washington Region
As shown in Figure 5, the trends in 25-34 year olds differed for men and women. The change in the number of women was consistently smaller than the change in men. As a result, the overall losses in this age group was disproportionately driven by women.
The absolute increases in the number of women aged 25-34 years old lagged that of men in 2011, 2012 and 2013. Because women account for a slightly larger share of this age group (51.2% in 2010), the difference was somewhat larger on a percentage basis.
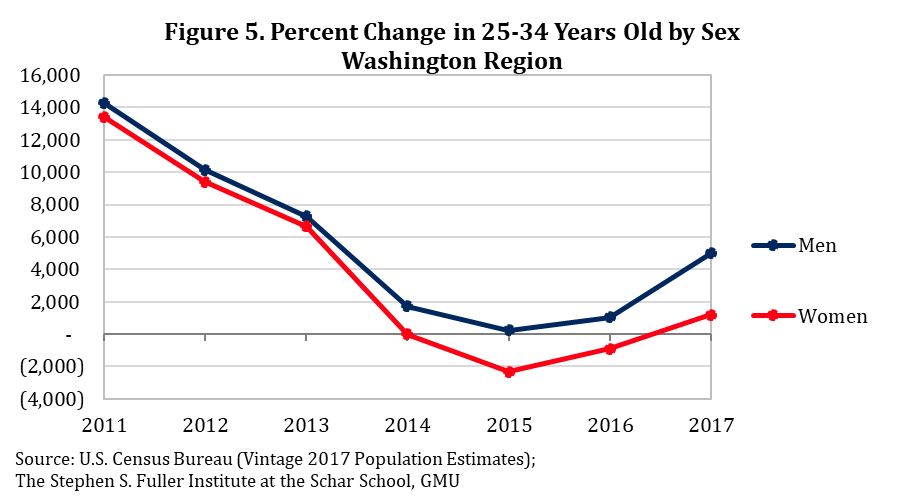
The number of women aged 25-34 years old decreased minimally in 2014 (-20 people and -0.004%), while the number of men continued to increase, albeit at a slower rate than in prior years (+1,730 people and +0.4%). In 2015, the number of people in the 25-34 age group decreased, with the losses driven entirely by women, and predominantly by women aged 25-29 years old.
Trends by Race and Ethnicity in the Washington Region
Figure 6 shows the change in 25-34 year olds by select race and ethnicity. The overall trend in 25-34 year olds was driven by white and not Hispanic people and Hispanic people of any race. All other races and ethnicities had annual gains throughout the period.
The annual population change in 25-34 year olds was relatively stable for non-Hispanic people who were either Black/African American, Asian or multi-racial. The population in these groups had consistent growth and accounted for a net gain in this age group for each year during this time period.
The losses in 25-34 year olds were driven entirely by people who were either Hispanic (of any race) or white and not Hispanic. The number of 25-34 year olds who were Hispanic decreased starting in 2013. The losses accelerated through 2015, and the Washington region had 3,315 fewer Hispanic residents aged 25-34 in 2015 compared to 2014 (-2.0%). In 2016 and 2017, the losses moderated. In 2017, the region was home to 1,310 fewer Hispanic residents aged 25-34 compared to 2016 (-0.8%). The overall Hispanic population in the region had continuous gains during this period and the losses in the 25-34 year old age group were offset by larger increases in other ages.
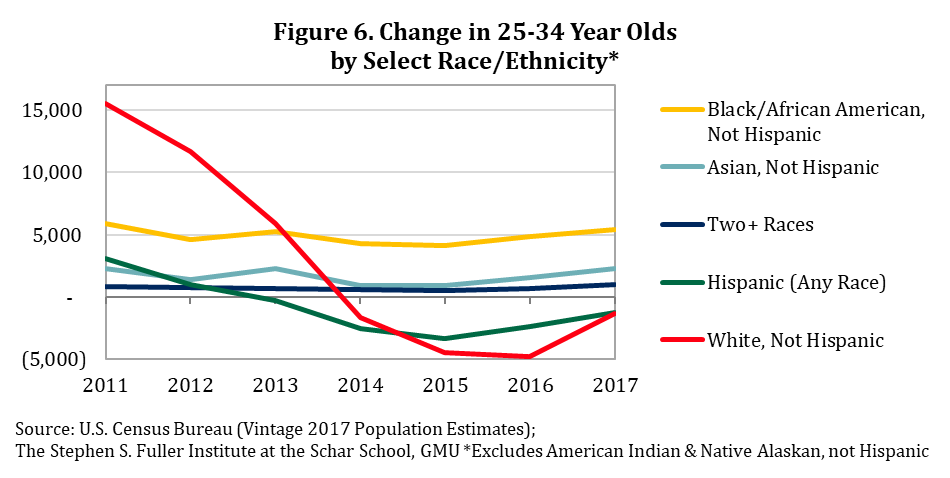
The change in the white and not Hispanic population was similar to the overall pattern of growth in 25-34 year olds during this period. Gains in 2011 and 2012 were relatively large, but slowed quickly. By 2014, the region had losses in the number of white, non-Hispanic people aged 25-34. These losses accelerated through 2016, when the region had 4,750 fewer white, non-Hispanic residents aged 25-34 compared to 2015 (-1.1%). The losses moderated to -1,310 (-0.3%) in 2017. The 25-34 year old age group mirrors the overall pattern of change for all white, non-Hispanic residents in the Washington region. Overall, growth in white, non-Hispanics slowed between 2011 and 2013, turning negative in 2014.
Conclusion
The one-year changes in 25-34 years is an important indicator of the Washington region’s attractiveness to young adults. The recent trends show that the slowdown that occurred in 2014 and 2015 has passed and the number of 25-34 year olds is following an upward trajectory. Even so, the region continued to underperform both the nation and the other large metros in 2017, suggesting that the region remains relatively less attractive than it was in 2011 and 2012.
About These Data
These data are from the Vintage 2017 County Population by Characteristics Estimates from the U.S. Census Bureau released June 21, 2018, the Vintage 2016 County Population by Characteristics Estimates released June 22, 2017, and the 2000-2010 Intercensal Population Estimates by Characteristics released September 2011. All data are estimates as of July 1 of each year. The 2013 metropolitan statistical area delineations are used throughout for all metros and all years. The largest metros are measured by Gross Regional product in 2016.
The current data are estimates based on 2010 Census counts and administrative data and will be revised in 2020, after the release of the 2020 Census. The Population Estimates data examined in this report are used as controls in both the American Community Survey and other major surveys. The full methodology is available on at the Census’s website.
Additional Maps by Jurisdiction