
Download “Demographic Change in the Washington Region: 2015-2016” as a PDF
In 2016, the number of residents in the Washington region increased by 53,508 people (+0.9%) from 2015. Population growth during this time was driven primarily by residents over 65 years old, mirroring national patterns. However, despite national gains, there were fewer 25-34 year olds in the Washington region in 2016 compared to 2015. The region also had the smallest change in this age group of the 15 largest metro areas. [1] The region continued to become more racially and ethnically diverse and population growth in 2016 was due entirely to increases in minority residents.
Change by Age Group
Population gains in the Washington region, like the nation, were driven primarily by increases in older residents. Between 2015 and 2016, the number of people aged 65-69 increased by 11,705 (+4.5%), the largest absolute increase of any five-year age group. This age group includes older Baby Boomers, the generation born between 1946 and 1964 who were 52 to 70 years old in 2016. In the Washington region, Baby Boomers accounted for about 19.4 percent of the population in 2016 (55-69 year olds). Altogether, the 55 to 69 year old age group drove 61.3 percent of the increase from 2015.
The number of 75 to 79 year olds increased 4.8 percent from 2015, the largest percentage increase of any five-year age group. Relatively large growth also occurred in the population over 80: 80-84 year olds (+2.7%), and 85+ year olds (+3.2 %). These gains may be related to continued improvements in healthcare and the ability to age-in-place and a similar increase occurred nationwide.
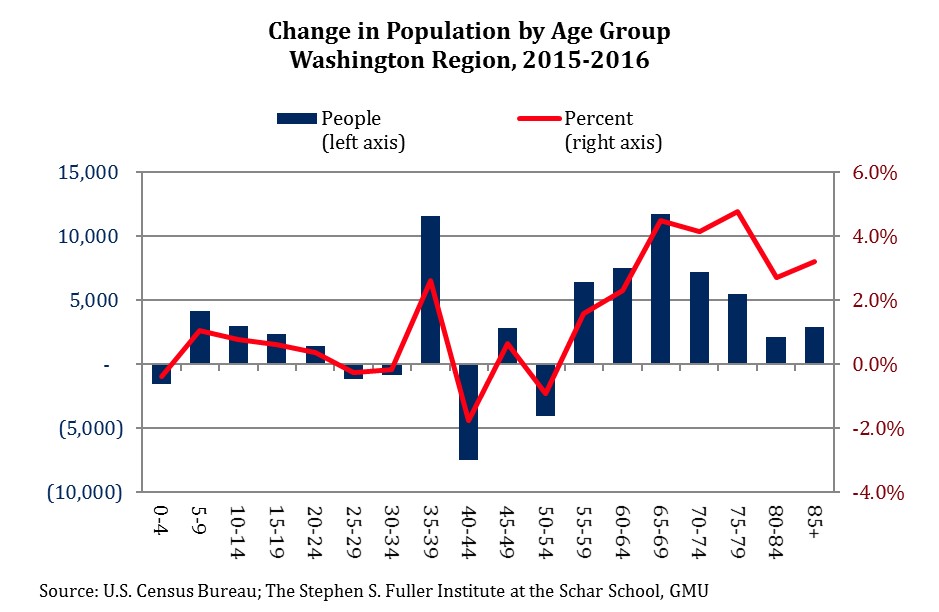
The second largest absolute increase was in the 35-39 age group. This age group includes the youngest members of Generation X and the increase in the Washington region matched the national increase. Regionally, this age group increased by 11,590 people or 2.6 percent. Nationally, this age group increased 2.3 percent.
The largest population decrease was among those aged 40-44 years old (-7,480 people, -1.7%). This age group also decreased nationally, falling 2.3 percent. Similarly, the decrease in 50-54 year olds mirrored national trends. In the Washington region, there were 0.9 percent fewer 50-54 year olds in 2016 compared to 2015; nationally, this decrease was 2.0 percent.
The number of people aged 25-34 years old, the two age groups that include the oldest members of the Millennial generation (those born between 1982 and 2000), decreased in the Washington region between 2015 and 2016. This is the fourth consecutive decrease for the 25-29 year old age group and the second consecutive decline for the 30-34 year old age group. Nationally, both age groups increased between 2015 and 2016: 25-29 year olds increased 2.2 percent and 30-34 year olds increased 0.8 percent.
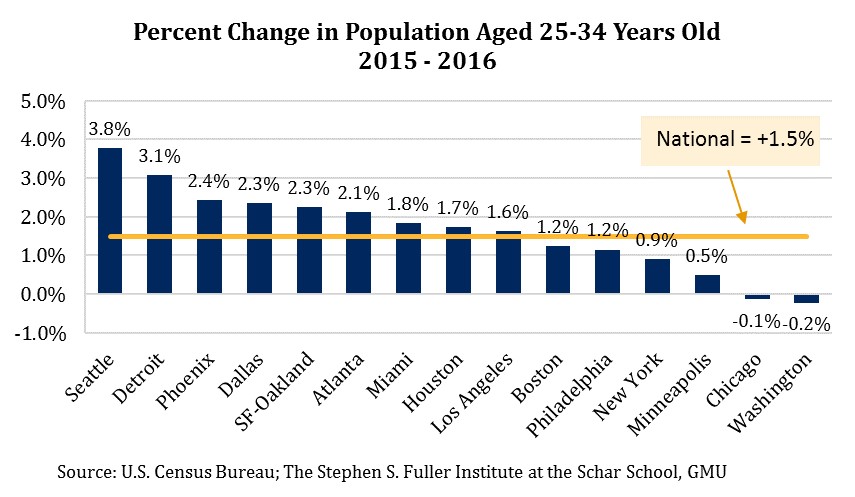
Of the 15 largest metro areas, the Washington region had the largest decrease in the number of 25-34 year olds. Only one other metro area, Chicago, had fewer 25-34 year olds in 2016 compared to 2015; all other largest metro areas had increases. Nine of these 15 metro areas gained residents in the 25-34 year old age group at a faster rate than the nation. Seattle had the largest percentage gain, rising 3.8 percent, followed by Detroit (+3.1%).
The declines in the 25-34 year old age group in the Washington region are in stark contrast with the national gains and the sharp increases in other peer metro areas. Recent population growth was led by those over 65 years old and growth in the prime working age population was mixed. Overall, the number of 25-55 year olds increased by just 849 people (+0.03%) in 2016 as a result of both national demographic trends and regional out-migration.
Change by Race and Ethnicity
The Washington region continues to diversify and the increase between 2015 and 2016 was driven entirely by minority populations. In 2015, 53.4 percent of the residents in the Washington region were a race and ethnicity other than white, non-Hispanic. By 2016, this share had increased to 54.0 percent. This diversification was the result both of absolute decreases in the white, non-Hispanic population and fast growth in minority populations.
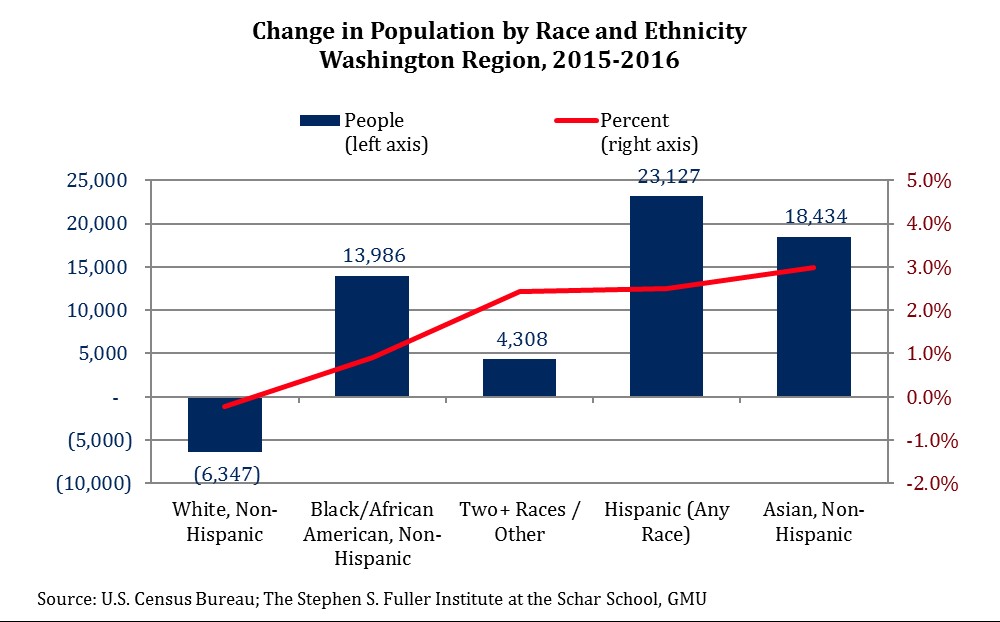
The number of Asian (including Native Hawaiian or Pacific Islander), non-Hispanic residents in the Washington region increased 3.0 percent between 2015 and 2016, over triple the rate of the population overall (+0.9%). Nationally, this race and ethnicity group also increased 3.0 percent. Of the 15 largest metros, the Washington region had the 10th largest increase in residents who were Asian and non-Hispanic.
The number Hispanic residents of any race increased 2.5 percent in 2016 and by 23,127 people, the largest absolute increase of any race and ethnicity group. Nationally, the number of Hispanic residents increased 2.0 percent, a somewhat smaller gain than in the Washington region. Of the largest metro areas, the Washington region had the 8th largest increase in Hispanic residents. Combined, population gains from residents who were Asian, non-Hispanic or Hispanic of any race accounted for 77.7 percent of the population gain from 2015.
The number of black or African American, non-Hispanic residents increased 0.9 percent, the same as the nation. Of the largest metros, the Washington region ranked 9th in terms of growth for this race and ethnicity group. Four of the large metros had fewer black or African American, non-Hispanic residents in 2016 than in 2015: Chicago (-0.8%), San Francisco-Oakland (-0.6%), Los Angeles (-0.3%) and Detroit (-0.2%).
The number of white, non-Hispanic residents decreased 0.2 percent, or by 6,347 people, marking the third consecutive decline. Nationally, the number of white, non-Hispanic people increased 0.003 percent, but nine of the 15 largest metro areas also had declines. Of the largest metro areas, the region ranked seventh for change in the white, non-Hispanic population.
While the region diversified at a modestly faster rate than the nation in 2016, it remained the fifth most diverse largest metro in 2016, the same rank as in 2015. The other largest metros diversified at similar rates.
Conclusion
The Washington region relied on residents over 55 years old for growth in 2016. The prime working age population in the Washington region was nearly unchanged from 2015. The Washington region had fewer 25-34 year olds in 2016 than in 2015 and has had two consecutive declines for this age group. In contrast, this age group had national increases and all of the largest employment metros had larger increases (or a smaller decline). This shifting population will pose challenges for the region’s workforce and housing markets going forward.
The Washington region diversified at a somewhat faster rate than the nation but similar to the rates of the other largest metros. The white, non-Hispanic population decreased and has done so for the three consecutive years. Nationally, the white, non-Hispanic population increased modestly and is forecasted to continue to do so in the near-term. However, the non-white population is forecasted to grow significantly faster throughout the nation and it is likely that this pattern will continue in the Washington region, as well.
About These Data
These data are from the Vintage 2016 County Population by Characteristics Estimates from the U.S. Census Bureau, released June 22, 2017. All data are for July 1 of each year. The 2013 metro region delineations are used throughout for all metros and all years. These data are estimates based on 2010 Census counts and administrative data and will be revised in 2020, after the release of the 2020 Census. The national forecasts are from the vintage 2014 forecasts by the U. S. Census Bureau.
[1] Ranked by Gross Regional Product in 2015