
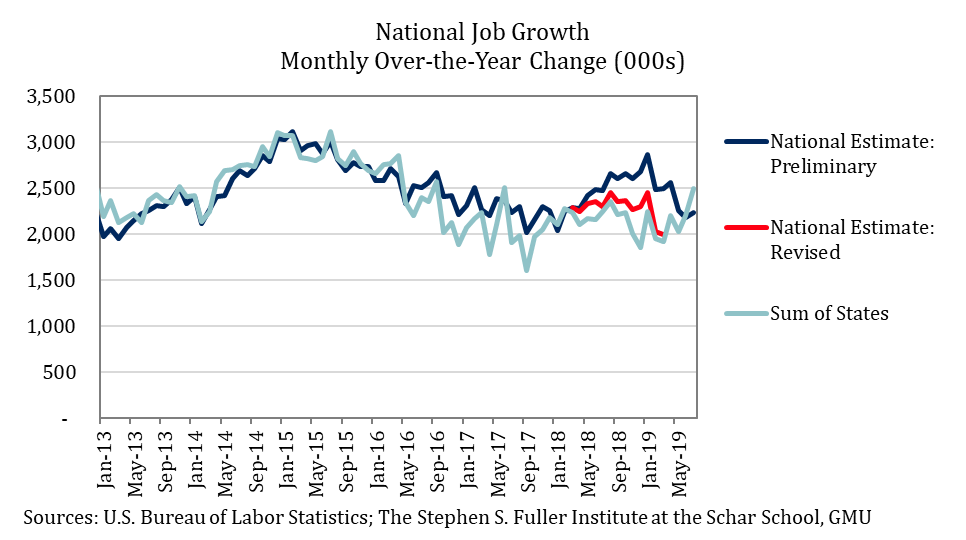
On August 21, 2019, the U.S. Bureau of Labor Statistics (BLS) released the preliminary revision for national jobs data. According this preliminary adjustment, the U.S. added 501,000 (20.1%) fewer jobs between March 2018 and March 2019 than were initially reported: the preliminary estimate showed a 12-month gain of 2,496,000 jobs while the revised estimate is for a gain of 1,995,000 jobs. This is an unusually large revision for this business cycle, although revisions of this magnitude have occurred at pivot points during prior cycles. These revisions will updated later in the year and the final revision will be incorporated in 2020.
What This Means for Regional Jobs
One-half million jobs were revised away from the national estimate for March 2019. Where were these jobs initially allocated? Perhaps surprisingly, the short answer is nowhere.
Intuitively, totaling all the jobs in every state should equal all jobs in the U.S. However, each geography is estimated separately by BLS, so these two estimates never match perfectly. During the 4Q 2018 and 1Q 2019, these estimates diverged with the national estimate showing an average 12-month gain that was 567,700 jobs larger than the gain that was reflected by the states. This divergence was unusually large and indicated that a large revision would occur. Because of this issue, the Stephen S. Fuller Institute has been using the job growth reflected by all states, not the national total, since March.
In short, the national revisions are correcting an underlying estimation procedure that does not appear to have affected local data, overall. This does not mean that there will not be any sub-national revisions, only that the local revisions will not mirror the national revisions.
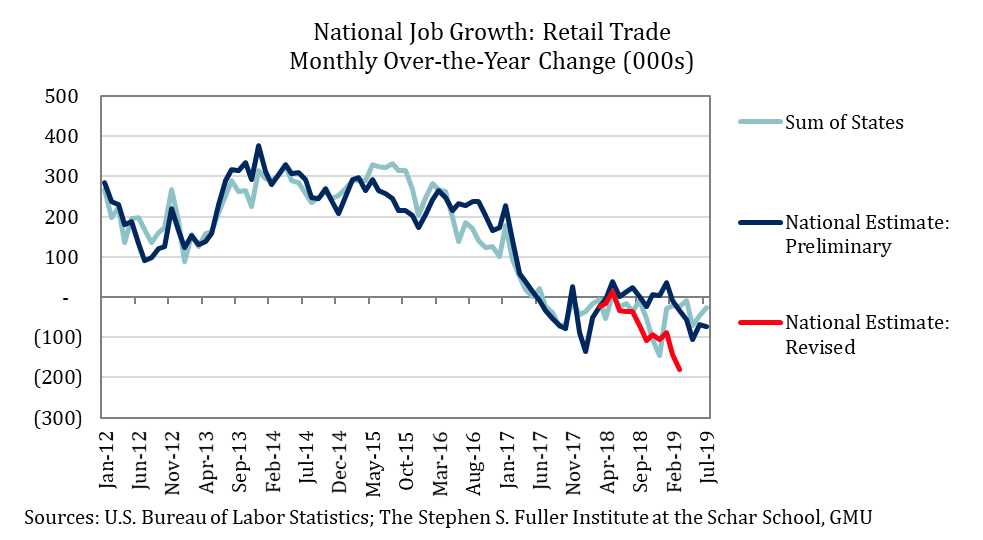
Three sectors accounted for the majority of the national revisions: Leisure & Hospitality, Professional & Business Services, and Retail Trade. The national estimates for both the Leisure & Hospitality and Professional & Business Services sectors were revised to be closer to the estimates shown by totaling the state-level data. As a result, it is unlikely that the national revisions will translate to large revisions in those sectors, on net, in the local data.
The national revision to Retail Trade does indicate that retail jobs were weaker than the local data initially reported. Instead of stabilizing after the losses in mid-2017 through early-2018, it now appears that the losses in Retail Trade accelerated through 1Q 2019. This revision is likely to carry through to the Washington region’s Retail Trade jobs resulting in a downward revision to the 4Q 2018 data.
Recent Job Growth in the Washington Region
The national revisions will likely not translate directly to the Washington region, beyond a modest decrease to the Retail Trade sector. However, the Washington region’s jobs data are subject to a different methodological quirk that is affecting the most recent release. Historically, the initial 12-month gain in July has been overestimated and is significantly revised downwards by the revisions that are released the following March.
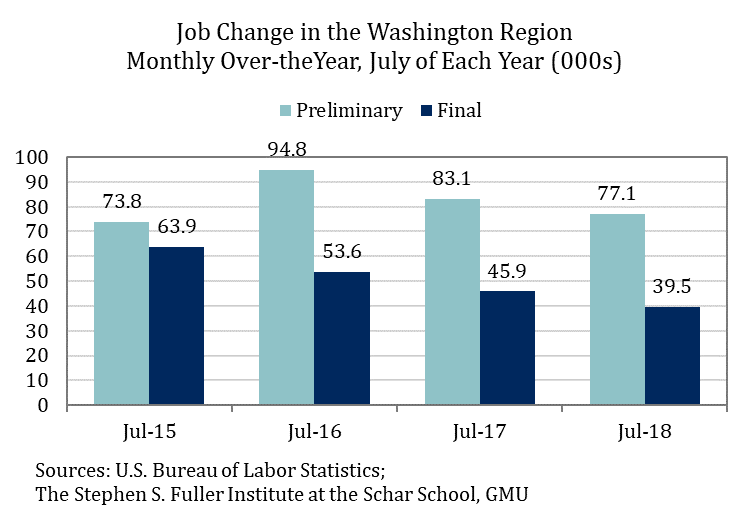
The revision is typically concentrated in two sectors, State & Local Government and Leisure & Hospitality, which have different levels of activity in July than during the rest of the year. These summer patterns are most likely adding noise to BLS’s model. As a result, the initial July estimates for the region are not meaningful and should not be used to measure the true trend.
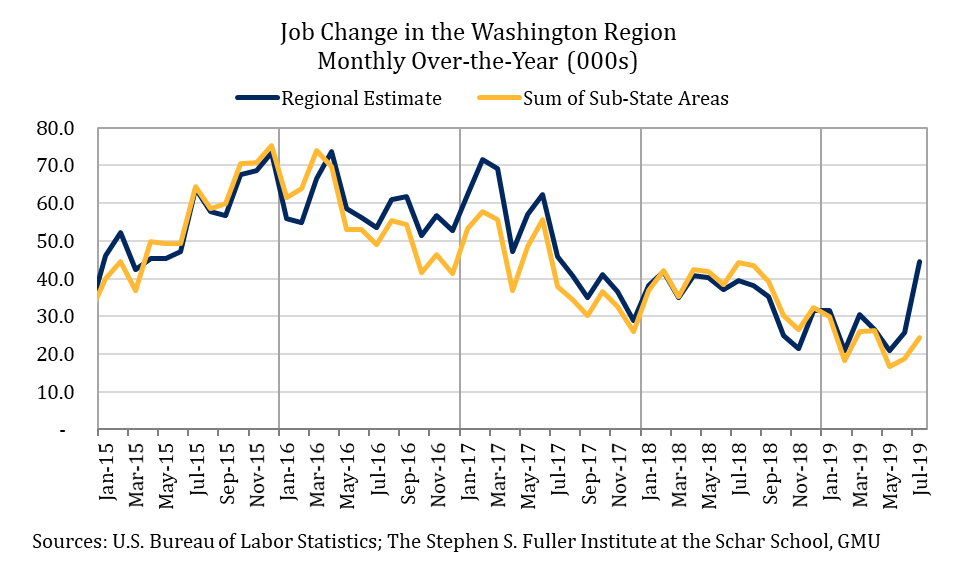
Fortunately, there is an alternative estimate for the Washington region’s jobs in July. BLS produces separate estimates for four areas within the Washington region: D.C., Northern Virginia, Montgomery County, MD & Frederick County, MD (combined), and Prince George’s County, MD & Calvert County, MD & Charles County, MD (combined). The sum of these sub-state areas never matches perfectly with the regional estimate; however, it typically follows the same trend.[1] When the regional estimate diverges from the sub-state totals, it indicates that one, or all, of these series will be revised the following March.
In July 2019, the regional estimate reflected a sharp acceleration in job growth and a gain of 44,600 jobs from July 2018. The gain shown by totaling the sub-state areas was 24,400 jobs, a change that is consistent with the performance earlier in the year. That is, nearly one-half (45.3%) of the job growth shown by the regional estimate was not allocated to D.C., Northern Virginia or Suburban Maryland. In past years, the sub-state total for the preliminary July estimate has been closer to the final estimate.
Based on the historic patterns of revisions, the Stephen S. Fuller Institute will use the sum of the sub-state areas for July 2019 in place of the regional estimate. July data also typically mark the beginning of a deterioration in the model’s accuracy. Revisions to the second half of the year are usually the largest. To address this, the Institute will carefully monitor all data series and may report out a combination of estimates (mixing the regional estimate and the sum of the sub-state areas) or only the year-to-date average, which dilutes the estimates errors, depending on which appears to be the most correct.
About These Data
All data are from the U.S. Bureau of Labor Statistics. The preliminary national estimates are from the Current Employment Statistics (National) series released August 2, 2019. The state-level data used to calculate the sum of the states are from the Current Employment Statistics (State & Local Area) series released August 16, 2019. The preliminary national revisions are from the CES Preliminary Benchmark Announcement and are available here. The revisions for April 2018 through February 2019 were estimated by the Stephen S. Fuller Institute using the “wedge-back” approach for each sector shown in the Preliminary Benchmark. For more on this method and the benchmarking process, go here.
The Washington region data are from multiple releases. The “preliminary” release is from August of the year of the data. The “final” is the estimate as of August 16, 2019 and may reflect multiple revisions.
[1] Jefferson, WV is excluded from the sum of the sub-state totals. Between 2001 and 2018, the average 12-month change in this county has been 164 jobs and its exclusion from the sub-state totals does not meaningfully affect the estimate.