
This is the second of two blogs covering this report. This post examines the five-year change in the oldest members of the Millennial generation, those born between 1983 and 1992, between 2012 and 2017. The first post examines the one-year changes in 25-34 year olds between 2010 and 2017.
The oldest Millennials are a birth cohort including people who were born between 1983 and 1992. In 2017, this birth cohort was between 25 and 34 years old and included 936,360 people living in the Washington region. In 2012, this cohort was between 20 and 29 years old and only included 834,460 people in the Washington region. This 12.2 percent increase primarily reflects a net five-year in-migration (both international and domestic) as these oldest Millennials reached their late 20s and early 30s.
The Washington region has historically been a net importer of young adults as they “age up” from their early and late 20s into their late 20s and early 30s. The increase in the oldest Millennials that occurred between 2012 and 2017 was somewhat smaller than the increase that occurred in prior generations as they reached the same age. The youngest Generation Xers, including people born between 1971 and 1980, experienced the same “aging up” between 2000 and 2005. The increase in these youngest Gen Xers was 17.0 percent, 4.8 percentage points larger than the comparable increase in the oldest Millennials.
The Washington region was a net importer of adults as they reached their 30s and early 40s, but the rate of gains slowed considerably. The region had net losses on a five-year basis of adults once they reached their late 40s. Going forward, these trends indicate that the Washington region will be less able to capture the members of the oldest Millennial generation as they all reach their 30s and beyond.
Defining Millennials
The number of the oldest Millennials living in the Washington region has increased as this generation reaches their late 20s and early 30s. Between 2012 and 2017, the number of the oldest Millennials, those born between 1983 and 1992, increased 12.2 percent in the Washington region. However, the Washington region has historically been a net importer of young adults, so an increase occurs regardless of the generational cohort. Compared to the increase in the youngest Generation Xers as they reached their late 20s and early 30s, the increase in comparably aged Millennials was relatively small.
The Millennial generation is a birth cohort, so the change in the number of 25-34 year olds between 2016 and 2017 is not entirely indicative of the change in Millennials. Because the Millennial generation is aging, a correct comparison of the same birth cohort of Millennials would be between the number of 25-34 year olds in 2016 compared to 26-35 year olds in 2017; in other words, the age groups would need to “age” with generation to reveal if the region were gaining/losing this birth cohort. Because these data are not available, this report will do the next best thing: look at the changes over a five-year period.
The Millennial generation typically refers to people born between 1982 and 2000. In 2017, this cohort was between 17 and 35 year old. The Washington region has historically been a net importer of people after they enter their 20s, so this report will continue to focus on Millennials older than 25. Similarly, these data are limited to five-year age groups, so this report defines the oldest Millennials as those born between 1983 and 1992.
Change in the Oldest Millennials in the Washington Region
In 2012, the region was home to 834,460 people who were born between 1983 and 1992 and were then between 20 and 29 years old. In 2017, this same birth cohort was five years older (between 25 and 34 years old) and included 936,360 people living in the Washington region. The net change of these oldest Millennials between 2012 and 2015 was an increase of 101,900 people and 12.2 percent.
Figures 1 and 2 show the change by birth cohort in five-year groups. These oldest Millennials are shown as 25-29 year olds and 30-34 year olds in 2017. The increase in the number of the oldest Millennials living in the region was driven by those who were 25-29 years old in 2017 and born between 1988 and 1992. This birth cohort increased 21.8 percent between 2012 and 2017. The number of residents born between 1983 and 1987 and were 30-34 years old in 2017 increased 4.3 percent from 2012 to 2017.
When compared to prior increases in the number of 25-29 year olds and 30-34 year olds of other generations, this five-year gain from the oldest Millennials is relatively small. For example, the youngest Generation Xers includes people born between 1971 and 1980. In 2005, this birth cohort was between 25 and 34 year old (the same age as the oldest Millennials examined here).
Figure 1 compares the recent increase in the oldest Millennials (born 1983-1992) and the prior increase in the youngest Gen Xers (born 1971-1980) as both cohorts “age up” from being 20-29 years old to being 25-34 years old. For the oldest Millennials, this occurred between 2012 and 2017. For the youngest Gen Xers, this occurred between 2000 and 2005. The label in the graph shows the age at the end of each time frame.
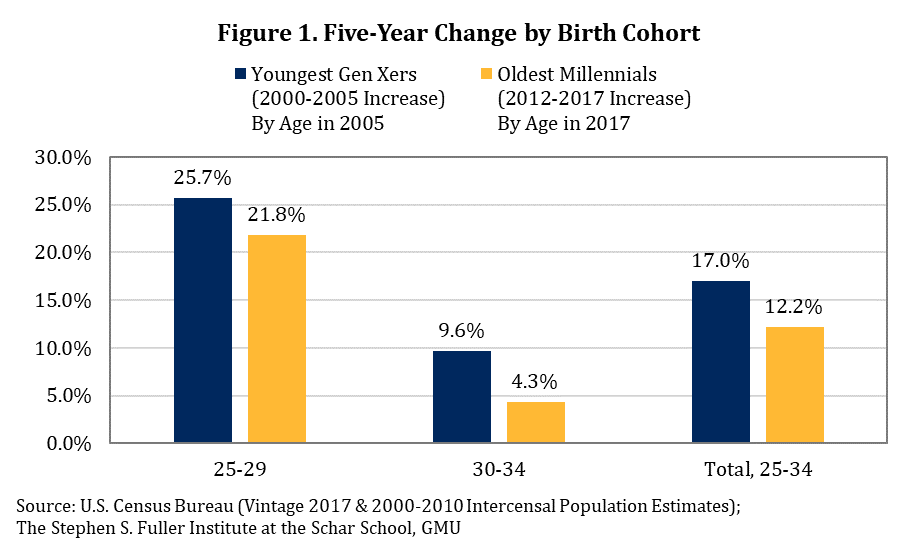
The Washington region was a net importer of the youngest Gen Xers as they reached their late 20s and early 30s. Overall, the number of youngest Gen Xers living in the Washington region increased 17.0 percent between 2000 and 2005, corresponding to this birth cohort “aging up” from being 20-29 to 25-34 years old. This increase was 4.8 percentage points larger compared to the same “aging up” of the oldest Millennials that occurred between 2012 and 2017.
Altogether, the Washington region had a net increase in the number of the oldest Millennials living in the region between 2012 and 2017. This gain, however, is somewhat smaller than for prior generations. Other research suggests that Millennials are leaving the Washington region at greater rates to live elsewhere in the nation, at least during part of this five-year period. That could mean that the total five-year gain was driven entirely by international migration, but the an equally likely explanation is that the domestic migration patterns contributed to some of this increase including some years with net gains and some years of net losses.
Change in All Generations in the Washington Region
Even with the net gains on a five-year basis of the oldest Millennials, the fact that the increase is weaker than for past generations will continue to have implications for the Washington region.
Figure 2 shows the change by birth cohort in five-year groups between 2012 and 2017. The largest gains by generation were from Generation Z, many of whom were born during the 2012-2017 period. The largest decrease was from the Silent and Greatest generations; the majority of this decrease was likely the result of deaths. The other five-year changes by generation primarily reflect migration patterns (both domestic and international), although death rates play a larger role for the cohorts in the older age groups.
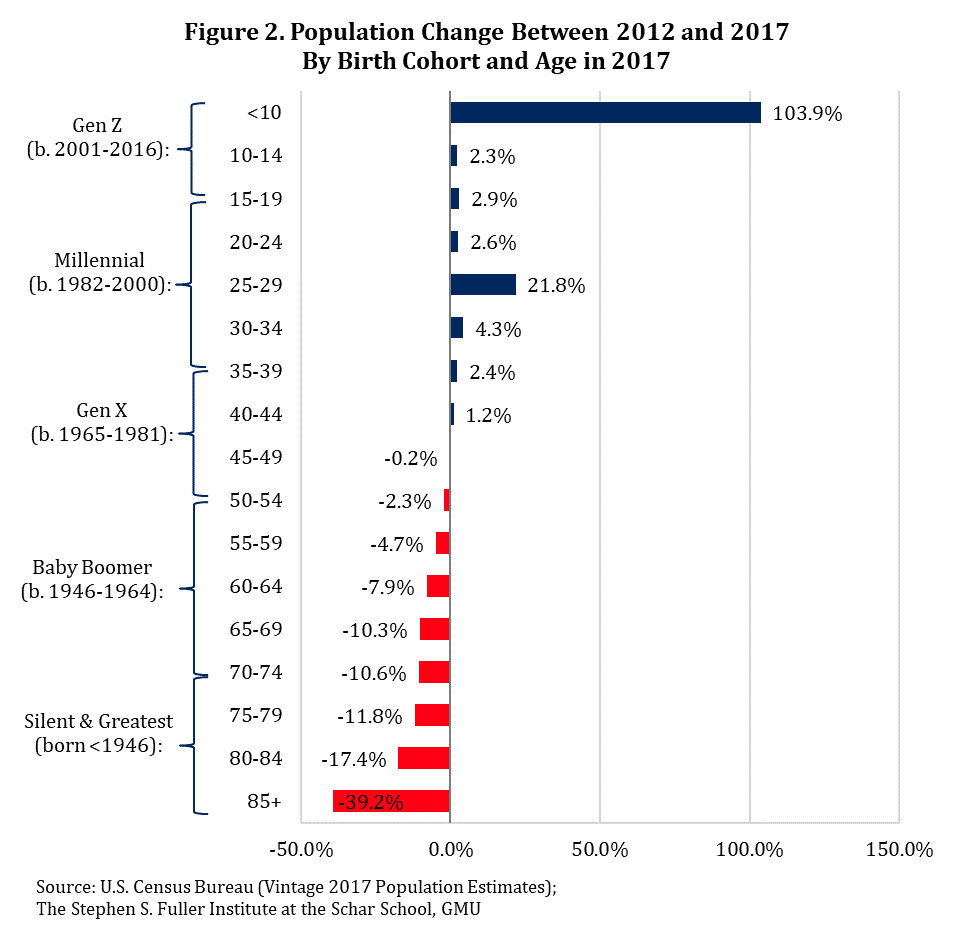
Aside from the large increase in the Millennials who were aged 25-29 in 2017, the growth for all other working-age generations during this five-year period was small. The region continued to be a net importer of adults as they reach their 30s and early 40s, but the region had net losses once people reach their late 40s.
This means that the magnitude of the change as young adults reach 25-29 and 30-34 years old has a lasting importance. The Washington region has been historically less likely to be a net importer of adults as they reach their late 30s. The smaller gain in the oldest Millennials in recent years is unlikely to be reversed as this cohort ages.
Conclusion
The number of the oldest Millennials living in the Washington region increased between 2012 and 2017, but this increase was somewhat smaller than for past generations when they were in their late 20s and early 30s. The one-year declines in 25-34 year olds were not indicative of a longer-term decline in the oldest Millennials, but may reflect a temporary weakness that subdued the overall gains during the five-year period. As all of the oldest Millennials enter their 30s, it will be increasingly unlikely that this older cohort of this generation will increase significantly.
About These Data
These data are from the Vintage 2017 County Population by Characteristics Estimates from the U.S. Census Bureau released June 21, 2018, the Vintage 2016 County Population by Characteristics Estimates released June 22, 2017, and the 2000-2010 Intercensal Population Estimates by Characteristics released September 2011. All data are estimates as of July 1 of each year. The 2013 metropolitan statistical area delineations are used throughout for all metros and all years. The largest metros are measured by Gross Regional product in 2016.
The current data are estimates based on 2010 Census counts and administrative data and will be revised in 2020, after the release of the 2020 Census. The Population Estimates data examined in this report are used as controls in both the American Community Survey and other major surveys. The full methodology is available on at the Census’s website.