
By Ellen Harpel, President, Business Development Advisors, and Jeannette Chapman, Deputy Director and Senior Research Associate at The Stephen S. Fuller Institute
This is the second of three blogs covering this report. In the first blog, we look at the major trends in non-employer establishment growth over time. In this blog, we compare these trends in the Washington region with its peer metros. In the third blog, we look at the types of work being performed by non-employer establishments in the region.
Download the full report as a PDF>>
The US has also experienced significant growth in non-employer establishments, from 15 million in 1997 to over 24 million in 2015. Still, the Washington region outpaced US growth and that of most of the other large metropolitan areas. Of the 15 largest metros, the Washington region had the sixth largest increase in non-employer establishments between 1997 and 2015. Miami had the fastest growth, rising 141.7 percent and ranking third in terms of total number of non-employer establishments in 2015. Atlanta and Houston ranked second and third in terms of growth, respectively.

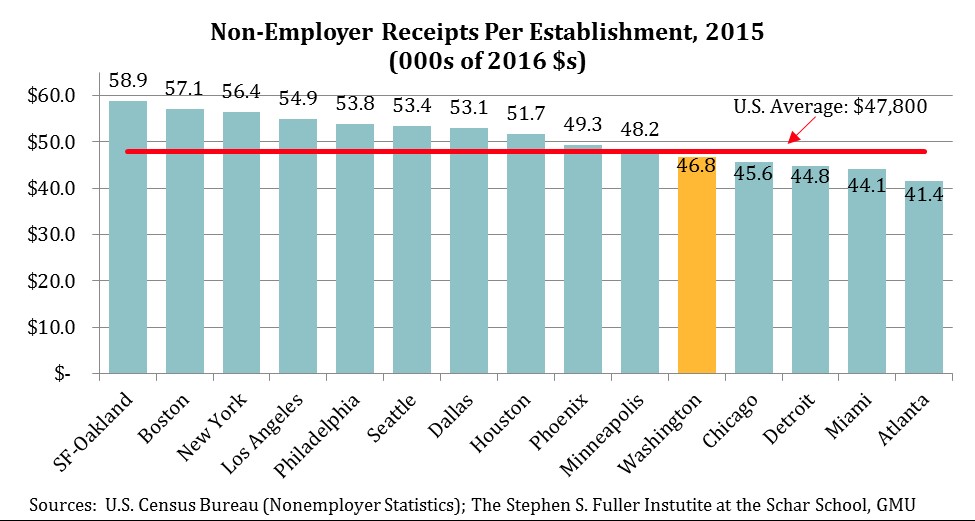
Per establishment non-employer receipts were very similar in the US and the Washington region, with the US generally slightly higher in recent years. In 2015, inflation-adjusted receipts per non-employer establishment in the US were $47,810 compared to $46,770 in the Washington region. The lower average receipts in the Washington region were primarily the result of the industry-mix, as the Washington region had a somewhat smaller proportion of Construction and Real Estate & Rental & Leasing activity than the nation.
There was much greater variation in receipts per non-employer establishments across other large metro areas. Average receipts ranged from $41,400 in Atlanta to $58,900 in the San Francisco-Oakland in 2015. The Washington region ranks 11th among the largest 15 metros by this measure. In 1997, the Washington region ranked 14th in terms of per establishment receipts. It rose to 10th and maintained that ranking from 2005 through 2012. In 2013, the Washington region was surpassed by Minneapolis and ranked 11th between 2013 and 2015.
The metros with the largest increases in non-employer establishments, Miami and Atlanta, had the lowest average receipts. While Miami ranked 11th or lower between 1997 and 2015, Atlanta ranked 4th or 5th early in the period, indicating that growth in establishments was driven by lower-value establishments.
The growth in non-employer establishments in the Washington region has exceeded that in the nation and the majority of the largest metro areas. The receipts per establishment in the Washington region lagged both the national average and the average in most large metro areas. However, the Washington region’s average receipts have been relatively low since 1997 and its position has improved somewhat over time.
About These Data
All non-employer statistics are from the U.S. Census Bureau’s Nonemployer Statistics Datasets. Employer statistics are from the U.S. Census Bureau’s County Business Patterns. For all metro areas, the 2013 metropolitan statistical definitions were used, aggregating from the county-level files. The largest metro areas are defined by Gross Regional Product. National data are from the United States files for both the non-employer statistics and county business patterns.