Guest Post by Lokesh Dani, Graduate Research Assistant and doctoral candidate at the Schar School of Policy and Government, GMU
Download as a PDF>>
Automation is seen as a big challenge for society generally and the labor market specifically. Yet, we do not have a full understanding of how automation is changing the labor market and debate even continues whether automation has a net negative, or a net positive impact on jobs. This post examines the change in occupations that have the largest degree of automation[1] by their skill level (low-, middle- and high-skill)[2] in both the US and the Washington region.
Since 2000 US employment in low-skill automated occupations has declined by about 1.8 million jobs, while that of high-skill automated occupations has steadily increased by about 1.2 million jobs. Middle-skill automated occupations have similarly increased employment by 573,000 jobs (Figure 1). The net gain of employment in automated occupations has been a mere 7,300 jobs. This is a small net change in employment considering automated occupations account for 12 percent of all employment in the US as of 2017.
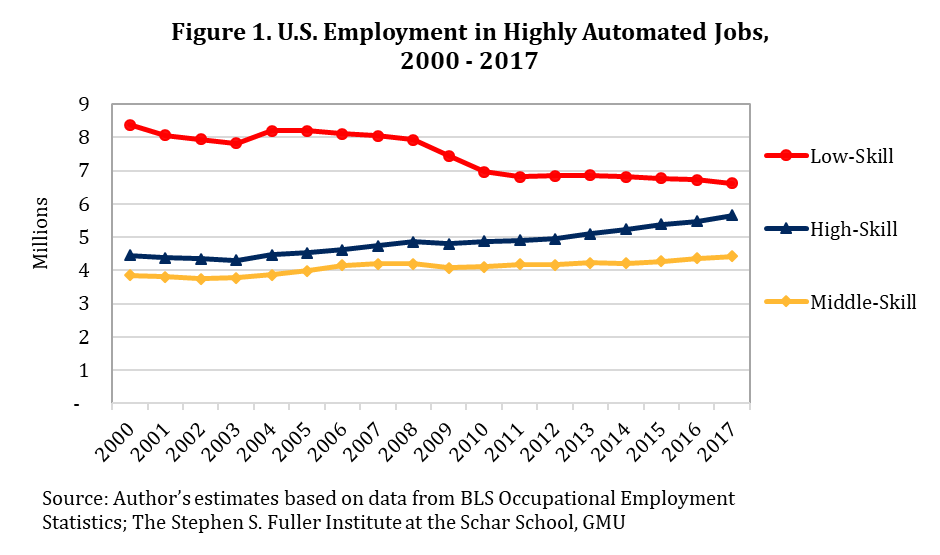
This pattern of declining low-skill employment at nearly the same rate as the increase in high-skill employment in automated occupations, as seen in figure 1, perhaps sheds some light on why the debate continues whether automation is good or bad for the economy.
Yet, these trends also suggest that high-skill automated occupations are likely to overtake low-skill automated occupations in employment levels over the next few years. For regional economies that have a higher concentration of high-skill automated occupations, this trend is likely a boon. But for regions that rely more heavily on low-skill automated occupations, these trends may suggest greater risks of unemployment, or at least reduced employment opportunities for a large section of their workforce. At the very least, they indicate a clear need for continued emphasis on improving re-training and up-skilling opportunities for workers. The remainder of this report takes a more granular analysis of the relationship between automation and employment and wages for workers in the Washington regional economy.
Employment Trends in the Washington Region
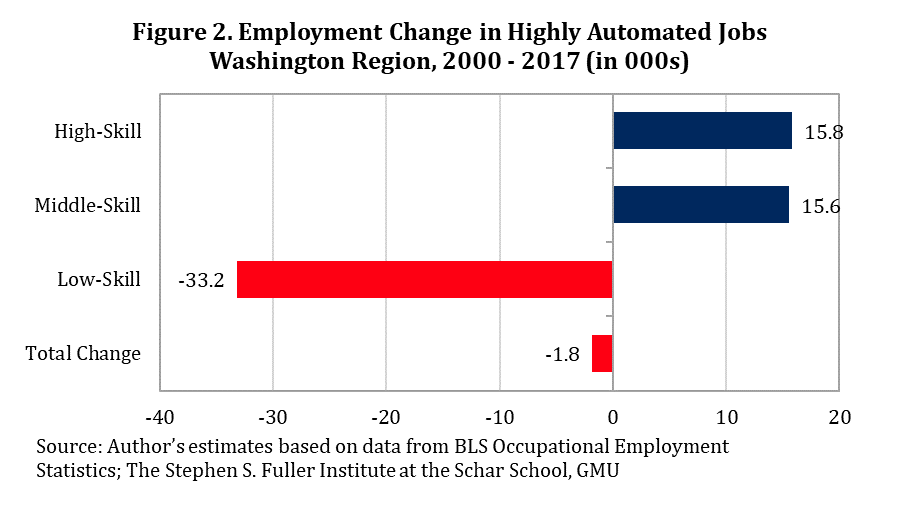
Automated occupations in the Washington region comprise 12 percent of all regional employment as of 2017 (same percentage as U.S.). However, while nationally there has been a small net gain in automated occupations, regionally these occupations have declined in net by about 1,800 jobs since 2000. This small but net negative decline represents less than 0.1% of the region’s employment as of 2017. Nonetheless, this small change masks a significant compositional shift in regional employment that favors skilled workers while undermining opportunity for less skilled workers.
Figure 2 below represents the difference in employment growth and decline between high-skill and low-skill occupations in the Washington region since 2000. Low-skill occupations, requiring a high school degree or below, account for an employment decline more than 33,000 jobs since 2000, while middle and high-skill occupations requiring a vocational degree or a bachelor’s degree respectively, contributed to the region’s employment gains of about 15,000 each. The net effect is a small decline of about 1,800 jobs in automated occupations.
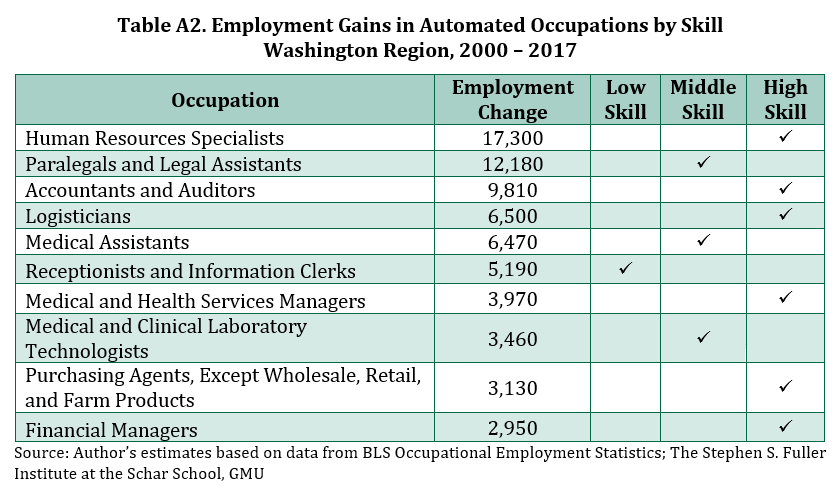
The low-skill automated occupations that declined the most in the region are ‘Data Entry Keyers’ (-9,930 jobs); ‘Telemarketers’ (-8,710 jobs); and ‘Mail Clerks and Mail Machine Operators, Except Postal Service’ (-4,520 jobs). Low-skill automated occupations to gain employment include ‘Receptionists and Information Clerks’ (+5,190 jobs).
The middle-skill automated occupations that decreased the most in employment are ‘Computer Operators’ (-5,820 jobs). While those to increase the most are, ‘Paralegals and Legal Assistants’ (+12,180 jobs); ‘Medical Assistants’ (+6,470 jobs); and, ‘Medical and Clinical Laboratory Technicians’ (+3,460 jobs).
The high-skilled automated occupations that declined the most in employment are, ‘Computer Programmers’ (-18,210 jobs); ‘Computer Systems Analysts’ (-8,530 jobs); and, ‘Airline Pilots, Copilots, and Flight Engineers’ (-3,850 jobs). High-skill automated occupations gaining most in employment include, ‘Human Resource Specialists’ (+17,300 jobs); ‘Accountants and Auditors’ (+9,810 jobs); and, ‘Logisticians’ (+6,500 jobs).[3]
When considering the decline in high-skill automated jobs, it is important to note occupations such as ‘Computer Programmers’ and ‘Computer Systems Analysts’ tend to require little face-to-face interaction. This increases their susceptibility to offshoring. Thus, these declines may not be wholly attributable to automation; they may have declined due to increased offshoring of these jobs out of the Washington region where wages are amongst the highest in the nation. Employment for ‘Computer Systems Analysts’, for instance, has increased nationally since 2000 but declined in the Washington region. On the other hand, employment in ‘Computer Programmer’ occupations have declined both nationally and regionally since 2000. This trend has likely resulted from related occupations to ‘Computer Programmers’, with more specialized skill profiles such as ‘Software Developers’ and ‘Database Administrators’, seeing greater employment gains.
Wages Differentials
Workers in highly automated occupations tend on average to earn a wage premium over workers in jobs with a low degree of automation. One possible reason for these higher wages is that automation tends to increase productivity of the job and this is reflected in the higher wages for workers in automated jobs. It would also be expected that automated jobs where workers need more training would be more likely to have even greater productivity and see even larger increases in wages. This is evident in the data both for the Washington region and nationally. Table 1 below reports the wage differential by skill levels for automated occupations between the US and the Washington region.
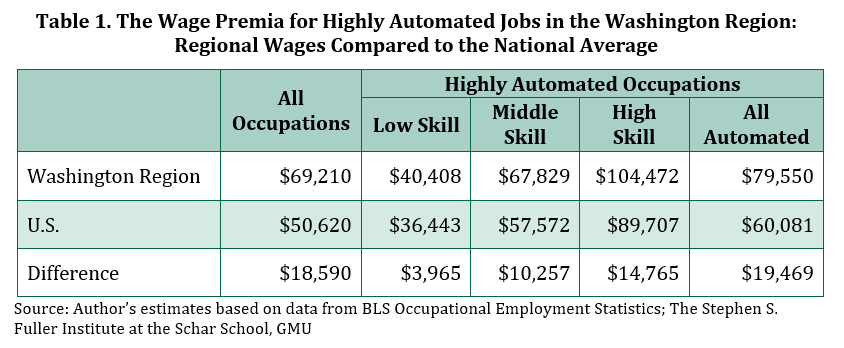
Notably, workers in the Washington region earn a wage premium of $18,590 on average compared to the national average. For automated jobs, this wage premium is slightly higher at $19,469. The difference in average annual wage for automated jobs compared to the nation increases at a greater rate with greater skills. With the Washington region having one of the highest concentrations of high-skilled workers in the country, the average wage premium accruing to high-skilled automated jobs in the region is even higher than nationally $14,765 greater. This suggest that the overall trends in automated jobs that favor high-skilled employment will continue to have a larger beneficial effect in terms of wage contribution to the Washington region economy than for the nation.
In 2017, the share of wages paid to workers in automated occupations accounted for 13 percent of all wages paid in the US but only 11 percent of all wages paid in the Washington region. Yet, wages paid to workers in high-skill automated occupations amounted to 7 percent of all wages nationally but a larger 9 percent regionally. For the Washington region, high-skill automated workers brought in $19.8 billion in wages in 2017, an increase of $10.1 billion from the level in 2000. In comparison, low- and middle-skill automated occupations in the Washington region experienced an increase of only $365 million and $2.6 billion annually, respectively, over the same time period.
Conclusion
Automation has been both a drag on and a boon to the growth of Washington region’s economy. Since 2000, workers in low-skill automated occupations have experienced dwindling opportunity for employment, while workers prepared for high-skill automated occupations have seen increasing opportunity on average. Yet, the region has also had a decline in high-skill automated jobs that require little face-to-face interaction on the job, as these opportunities have likely been priced out of the local labor market. In contrast, low-skill automated workers that require greater face-to-face interaction and complement the jobs of the high-skill workers, such as ‘Receptionists and Information Clerks’, have grown in the Washington region. Wage growth has similarly favored the high-skilled automated worker in the Washington region and the increased employment in these occupations has significantly bolstered total wage growth in the regional economy.
Finally, this analysis has confirmed that gross trends in automation should be considered carefully. Using the Washington region as an example, this analysis found that not all low-skill automated jobs have declined and, similarly, not all high-skill automated jobs have grown locally. Policy makers should be careful to consider not only occupation-level trends but also the interdependencies inherent among occupations to better understand and evaluate how automation is changing the region’s economy.
About These Data
This post used data from the US Bureau of Labor Statistic’s Occupational Employment Statistics as of 9/17/2018. The Washington region is the metropolitan statistical area that was current as of the year of the data and changes modestly over time. Both the skills levels and the degree of automation are defined using the O*NET occupational handbook as of 9/17/2017.
[1] For this report, I use a direct definition; the “Degree of Automation” for each occupation as reported by occupational experts and job incumbents in the O*NET occupational handbook. I code an occupation to be highly ‘Automated’ if its Degree of Automation is a standard deviation greater than the median occupation.
[2] Low-, middle- and high-skill occupations are defined as those requiring, little to some preparation; medium preparation; and, considerable to extensive preparation respectively. Other measures of automation have been applied in literature, such as the routine task content of occupations, or their IT-intensity of occupations.
[3] A list of the top 10 occupations to decline or increase in employment are reported in Table 1 and 2 below.
Additional Tables