The real per capita personal income (PCPI) measures wealth, the regional price levels and inflation by metro area. It allows for more comprehensive comparisons, both over time and between geographies, by accounting for regional price differentials and changes in price levels.
After adjusting for regional price levels, the per capita personal income in the Washington region was $56,670 in 2016. Of the 15 largest[i] metros, the Washington region had the fourth highest real PCPI. The region’s real PCPI increased 1.4 percent from 2015 but has increased a total of 2.7 percent since 2008, underperforming all other large metros except Houston.
The Washington region was 19.1 percent more expensive than the nation in 2016 and more expensive than all but two of the other large metros: San Francisco-Oakland and New York. While price growth in the Washington region has moderated in recent years, the region remains one of the highest cost metros, ranking ninth of all 382 metro areas.
Per Capita Personal Income and Real Per Capita Personal Income
The per capita personal income in the Washington region was $66,730 in 2016 and the third highest of the largest metro areas, behind San Francisco-Oakland and Boston. Because the Washington region is a high-cost area, a dollar purchases relatively fewer goods and services in this region compared to the national average. After adjusting for the differences in price levels, the real PCPI in the Washington region was $56,670. In other words, a household earning $66,730 in the Washington region would need to earn just $56,670 to have the same standard of living in an area that had the average national price levels.
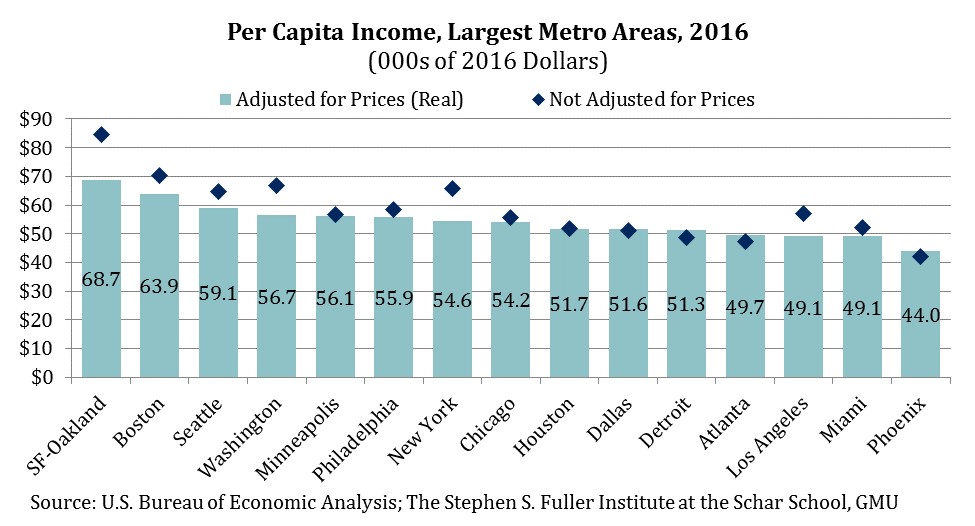
In real terms, the Washington region had the fourth highest PCPI of the largest metros, falling behind Seattle which had lower average prices. Other high-cost metros also decreased in rank after adjusting for price levels. Los Angeles ranked 13th in real terms but seventh prior to adjusting for price. Miami ranked 14th after adjusting for price but 10th before doing so. New York ranked seventh in real terms but fourth prior to adjusting for price.
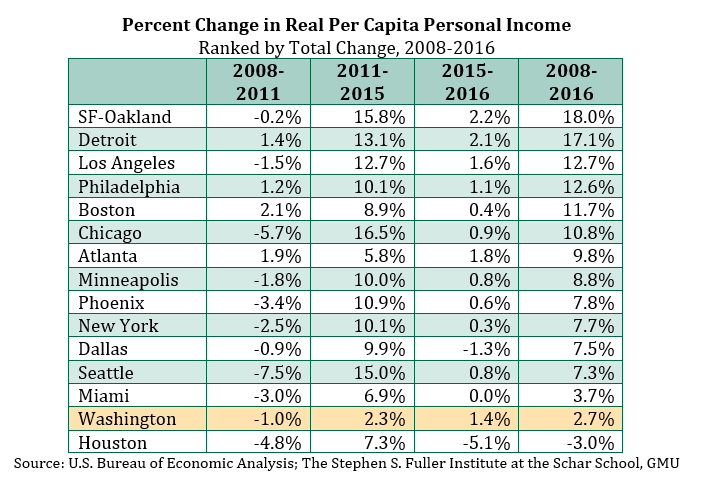
Change in Real Per Capita Personal Income: 2008-2016
Real per capita personal income in the Washington region increased 1.4 percent in 2016. Of the largest metros, the Washington region had the fifth fastest growth in 2016. However, between 2008 and 2016 the real per capita personal income in the Washington region increased a total of 2.7 percent, underperforming every large metro except Houston. This underperformance is largely the result of a sharp decrease (-3.7%) in 2013. While the other large metros also had decrease in 2013, the Washington region’s decline was the largest. Similarly, all other metros fully recovered from the 2013 decreases in 2014, but the Washington region did not do so until 2015.
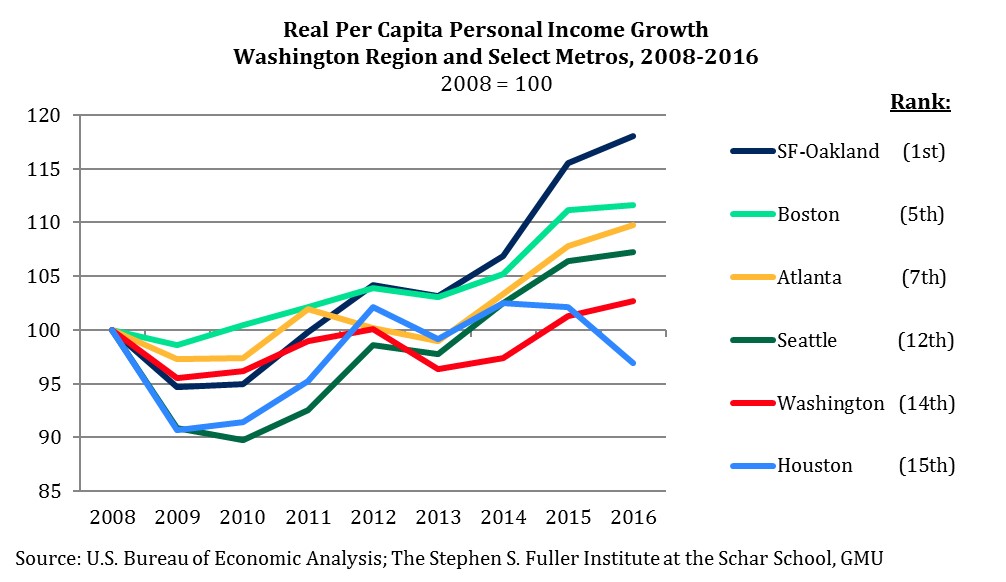
Prior to its decline in 2013, the Washington region had the third highest real PCPI of the largest metros. In 2013, the real PCPI in Seattle surpassed that in Washington region and has continued to do so. In 2014, Houston had a higher real PCPI than the Washington region. This reversed in 2015, when Houston’s real PCPI decreased. Houston’s real PCPI decreased again in 2016, reaching its lowest level since 2011. As a result, Houston’s real PCPI ranked 9th of the 15 largest metros in 2016, its lowest rank on record.
The recent gains in real PCPI in the Washington region have been above average, but not strong enough for the region to return to its third place ranking. In order to regain the third place rank, the Washington region’s real PCPI would need to increase at least 4.2 percentage points faster than Seattle’s in 2017. By contrast, real PCPI in Minneapolis would only need to grow 1.1 percentage points faster than the Washington region’s in 2017 to claim the fourth place rank.
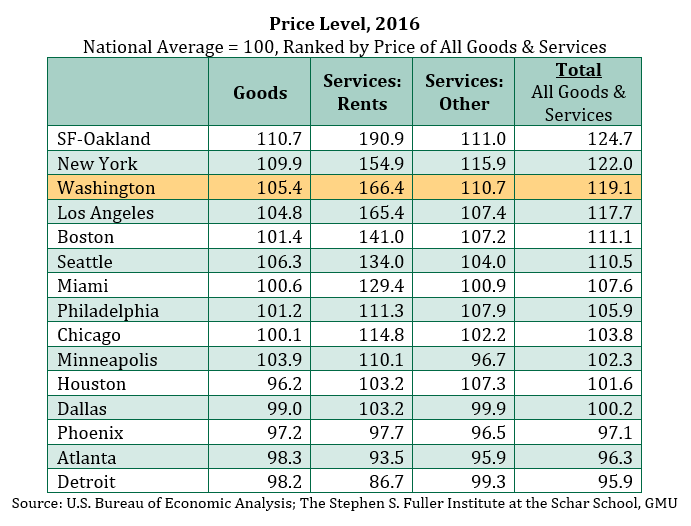
Regional Price Levels
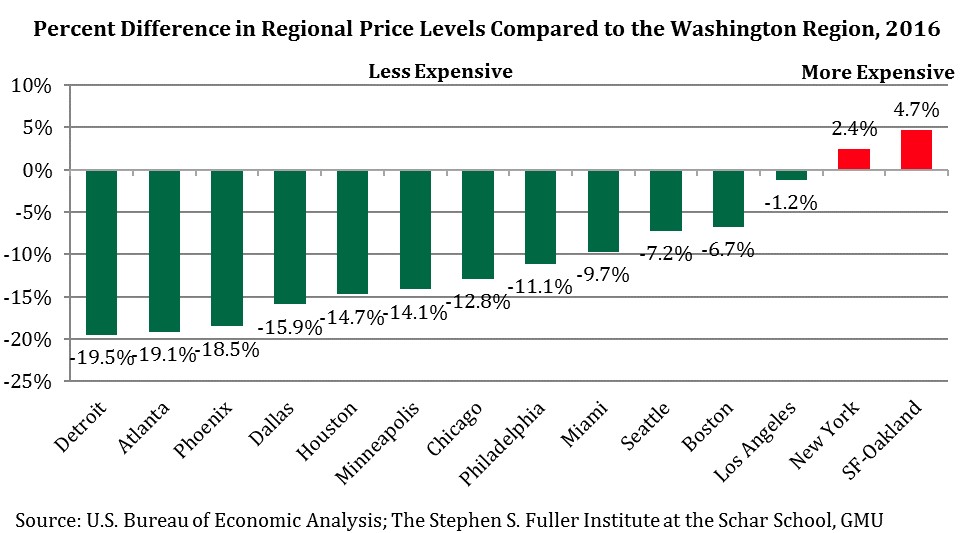
On average, prices in the Washington region were 19.1 percent higher compared to the nation. This means that 1.00 dollars of goods and services purchased in the Washington region would cost an average of 84 cents throughout the nation.
This price differential varies by metro area. Of the 15 largest metros, the Washington region was the third most expensive, behind the San Francisco-Oakland and New York metros. San Francisco-Oakland was 4.7 percent more expensive than the Washington region in 2016, while New York was 2.4 percent more expensive. All other large metros were less expensive than the Washington region. Average prices in Los Angeles were 1.2 percent lower than in the Washington region, while average prices in Detroit were 19.5 percent lower.
The average price levels are reported by three components: Good, Services: Rents, and Services: All Other. The Washington region’s price levels and rank were disproportionately driven by rents. Goods in the Washington region were 5.4 percent more expensive than the nation in 2016 and the fourth most expensive of the large metros. Non-rent services in the Washington region were 10.7 percent more expensive than the nation in 2016 and the third most expensive of the large metros.
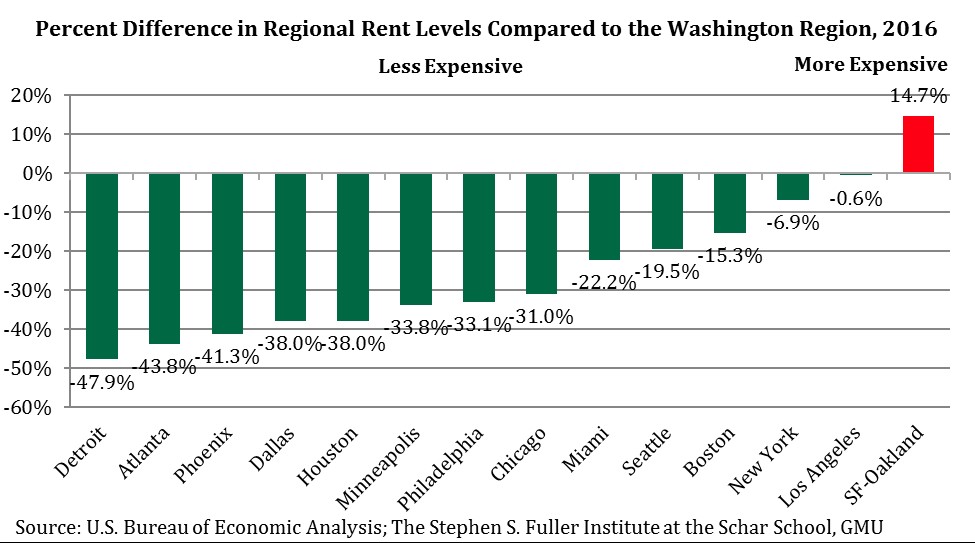
Average rent in the Washington region was 66.4 percent more expensive than the nation in 2016 and the second most expensive of the large metros, behind San Francisco-Oakland. The average price of rent in San Francisco-Oakland was 14.7 percent more expensive compared to the Washington region in 2016. The next most expensive rental market, Los Angeles, had an average rent that was 0.6 percent less expensive than the Washington region. Similarly, rent in New York was an average of 6.9 percent less expensive. All other major metros had rents that were 15.3 (Boston) to 47.9 (Detroit) percent less expensive.
Of all the 382 metro areas, the Washington region was the ninth most expensive in 2016, ranking 15th for goods, 12th for all non-rent services and eighth for rents. Prices in the Washington region have also increased faster than for the nation, overall, driven primarily by gains in 2009 and 2010. In 2008, the Washington region was 18.7 percent more expensive than the nation in 2008. By 2010, the region had become 20.7 percent more expensive than the national average. Relative price levels decreased modestly through 2013, and have been about 19 percent higher than the nation’s since that time.
Conclusion
The Washington region continues to be a one of the most expensive metro areas in the nation. Despite the high average prices, the region had the fourth highest real per capita personal income of the largest 15 metros and the 18th highest of all 383 metros in 2016. The region has had three consecutive years of real PCPI gains and has fully recovered from both the Recession and the decline that occurred during Sequestration (2013). Gains in the past two years were relatively strong compared to the other large metros. However, the region’s overall growth since 2008 has lagged all but one of the other large metros, primarily due below-average growth during the 2013-2014 period.
Prices increased faster in the Washington region than in the nation in 2009 and 2010. While relative price growth in the Washington region has moderated in recent years, relative prices remain higher than in 2008. Rents have driven this increase: in 2008, rents were 63.7 percent higher than the nation’s; by 2016, rents had increased to 66.4 percent higher. The prices of both goods and all non-rent services have grown more slowly than the national average. In the near-term, job growth is projected to result in somewhat stronger wage growth, which may also drive increases in prices. As a result, it is likely that the region will continue to become somewhat more expensive in the upcoming years.
About These Data
These data are from the U.S. Bureau of Economic Analysis. Regional real per capita personal income is from the May 17, 2018 release. Regional per capita personal income is from the November 16, 2017 release. National inflation was calculated using the implicit price deflators for Gross Domestic Product from the U.S. Bureau of Economic Analysis released on April 27, 2018. The same inflation factor was used to convert the chained 2009 dollars to 2016 dollars for the real per capita personal income. Regional price parities price levels are referred to in this post as regional price levels or average prices.
[i] Measured by Gross Regional Product in 2016
Additional Tables