With Congress debating the FY 2018 Budget and a tax reduction plan moving through Congress as well, there is an increasing likelihood that federal spending patterns in the Washington region will change in either magnitude (value) or distribution among agencies and programs or both in the coming year and beyond. This should not come as a surprise. The Trump Budget Blueprint, released last March, provided a glimpse at what the Administration was thinking. The impact of the Budget Blueprint was analyzed by the Stephen S. Fuller Institute and shown to have negative impacts on both federal employment and federal procurement contracting resulting in slower economic growth over the remainder of the decade.
The Washington region’s economy has weathered federal spending reductions before so the consequences are known. By examining the economic impacts of reductions in federal spending precipitated by the Budget Control Act of 2011, the impacts of these spending reductions on the region’s economy and its job holders and their incomes can be measured. Overtime, the consequences of these initial spending reductions mandated under the Sequester in 2013 can be traced as their secondary effects moved through the economy. Not all sectors experienced the same impacts and their magnitudes were not the same in all jurisdictions or were they experienced at the same times throughout the region and across its economy.
The magnitudes and patterns of economic impacts resulting from the spending reductions resulting from the Budget Control Act of 2011 are explored in the following pages. These impacts reflect the magnitudes, types, and duration of the spending reductions and so they will not precisely mirror the magnitudes, types and duration of economic impacts of future federal spending reductions should these occur. Still, the federal spending reductions that began in 2010 and deepened in 2011, 2012 and 2013 did generate significant economic effects confirming the dependence of the Washington region’s economic vitality with the magnitude of federal spending within the region’s economy. Increases in federal spending have accelerated the region’s economic growth from 1980 to 2010; decreases in federal spending in the region’s economy since 2010 have reduced its growth rates to the slowest among the nation’s 15 largest metropolitan areas. (See “The Washington Region’s Declining Economic Brand,” July 12, 2017).
The Impacts of The Sequester on the Washington Region’s Economy
The Budget Control Act of 2011 passed Congress and was signed by the President in August 2011. It provided for a ten-year budget savings of $1.5 trillion from cuts in discretionary accounts and capped the FY 2013 federal budget. The Act also established a process for Congressional approval of these spending reductions that would become mandatory—via sequester—in the absence of achieving Congressional agreement by January 2013. The magnitude of spending reductions included a 10 percent deduction in DOD spending authority and an 8 percent reduction in spending by non-defense agencies beginning in FY 2013; these spending reductions were to continue each fiscal year through FY 2021. DOD’s spending reduction was retroactive to FY 2012. The Congress was unable to agree on a budget plan to achieve these requirements by the January 1, 2013 deadline. As a result, the Sequester went into effect on March 1, 2013.
Even before the federal spending reductions mandated by the Budget Control Act went into effect, the new Republican-controlled House of Representatives began to tighten federal spending in an attempt to reduce the budget deficit that had ballooned in response to federal interventions to reverse the economy’s severe recession in 2008 and 2009. As a result, federal spending in the Washington region peaked in 2010 and the region experienced continuing federal spending reductions in each of the subsequent three years through FY 2013.
Declining Federal Employment
The impacts of these federal spending reductions first became apparent in the slowdown in the growth of federal employment in 2011 followed by the loss of federal jobs in 2012, 2013 and 2014, as shown in Figure 1. Federal employment in the Washington region peaked in mid-year 2010 at 387,700. By the end of 2010, total federal employment in the region had declined to 383,600. Year-end totals for 2011, 2012, 2013 and 2014 were 377,800, 377,900, 369,900, and 364,400 respectively, accounting for a loss of federal jobs totaling 23,300 by the end of 2014.
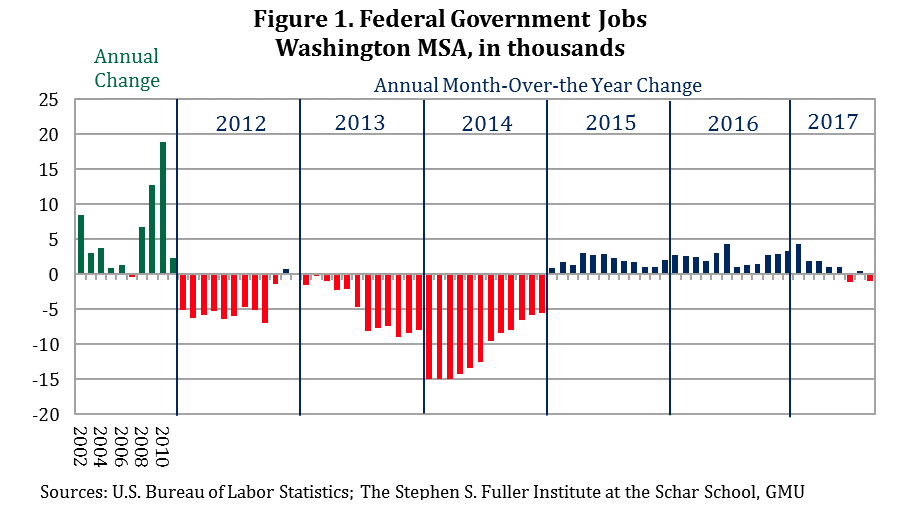
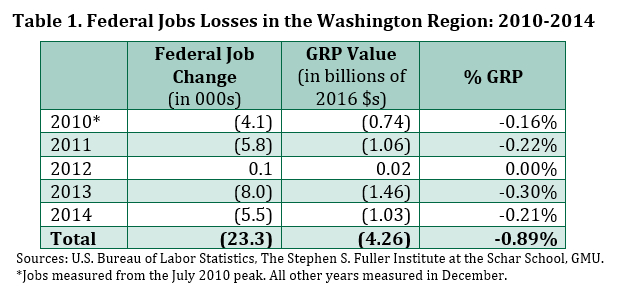
The economic value of these losses can be measured by multiplying these job losses by their average GRP-value to the regional economy; that is, the average value of each federal employee’s contribution to the region’s gross regional product. This per federal worker value was calculated at $187,499 in 2014 (in 2016 $). But, these declines in federal spending are cumulative and so are their economic impacts. The losses in 2010 are additive to the losses in 2011, 2012, 2013 and 2014. These cumulative economic effects are shown in Table 1.
Federal Procurement Spending Reductions
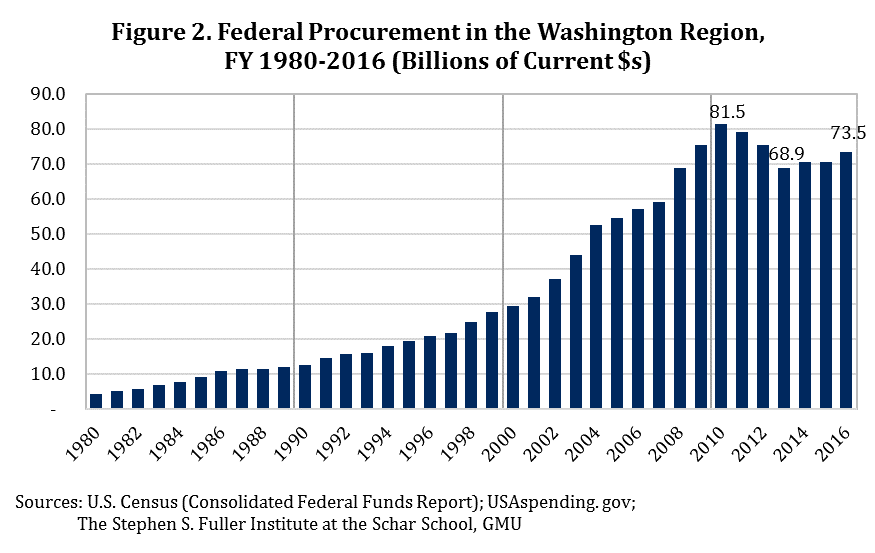
Federal procurement spending in 2010 total $81.5 billion; this was two times the value of federal payroll. Annual increases in federal procurement spending had been the driver of the Washington region’s economic growth for thirty years with its total increasing from $4.2 billion in 1980 to its peak in 2010 at $81.5 billion for a 30-year increase of 1,840.9 percent (see Figure 2). Research has established that the region’s the correlation between annual increases in federal procurement spending and annual increases in the region’s GRP had a R2 of 0.95; in Northern Virginia this R2 equaled 0.97, confirming an even more-predictive correlation.
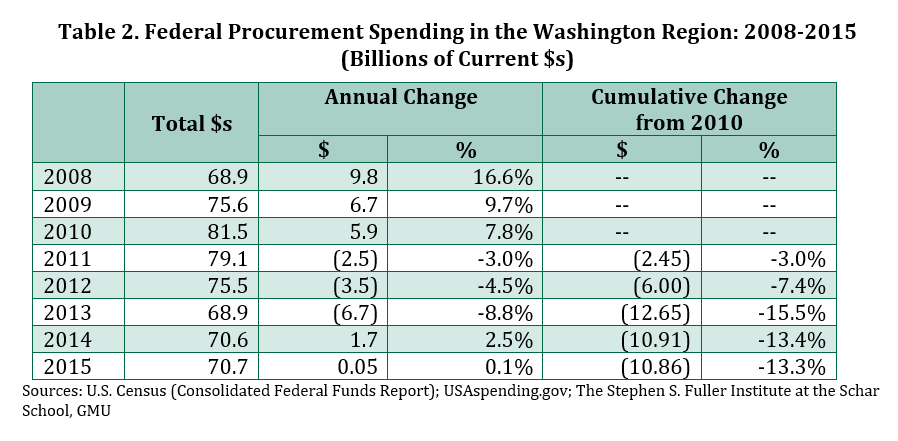
The pattern of federal procurement contracting in the Washing to region since 2008 is shown in Table 2. Following its peak in 2010, federal procurement spending declined each of the following three years losing a total of $12.7 billion by 2013, a decline of 15.5 percent. Federal procurement spending increased in 2014 by $1.7 billion to $70.6 billion, an increase but still 13.4 percent below its peak value.
The total employment effect of this spending is difficult to estimate. A Brookings Institute report, more than ten years ago, estimated that between 450,000 and 500,000, jobs possibly even more, were linked directly to federal procurement spending in the Washington region. Most all of these contractor jobs are classified as professional and business services; on average these jobs contribute $142,117 (in 2016 $s) per worker to the Washington region’s economy.
Some insight regarding the consequences of reductions in federal procurement spending can be seen in Figure 3 that shows the monthly over-the-year change in professional and business services jobs differentiating scientific and technical services from administrative support jobs. While this sector accounts for many of the federal contractors, others may be included on other sectors. Furthermore, the job totals presented here are net numbers. It is likely that some federal contractors, who lost employment in one sector, may have shifted to another sector employing the same skills sets. Still, other former federal contractors may have left the region to find employment elsewhere as the national economy was expanding during this period in which the Washington region was experiencing federal spending reductions.
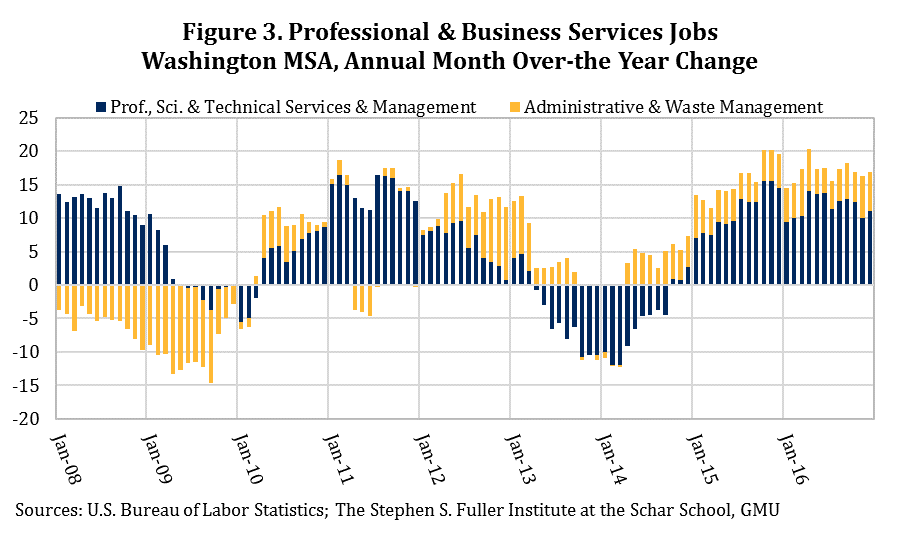
The jobs losses in the professional and business services sector during the Sequester, 2013 and 2014, were confined to scientific and technical services jobs, jobs directly dependent on federal contracting. These types of job actually stopped increasing in April 2013, one month after the official start of the Sequester. This pattern of job losses was opposite from its pattern of jobs losses during the Great Recession when scientific and technical services jobs continued to grow throughout 2008 and into 2009 and all of the job losses in this sector where administrative support jobs. The federal contractor jobs losses linked to the Sequester and resultant reductions in federal procurement spending were jobs that had been directly supported previously by federal procurement spending; job losses during the Great Recession were based on employer efforts to reduce operating costs, achieve greater production efficiencies, and to substitute office technology for in-house administrative support jobs. Reduction of scientific and technical service workers was not the immediate reaction to the economic downturn.
Secondary Economic Impacts of Federal Spending Reductions
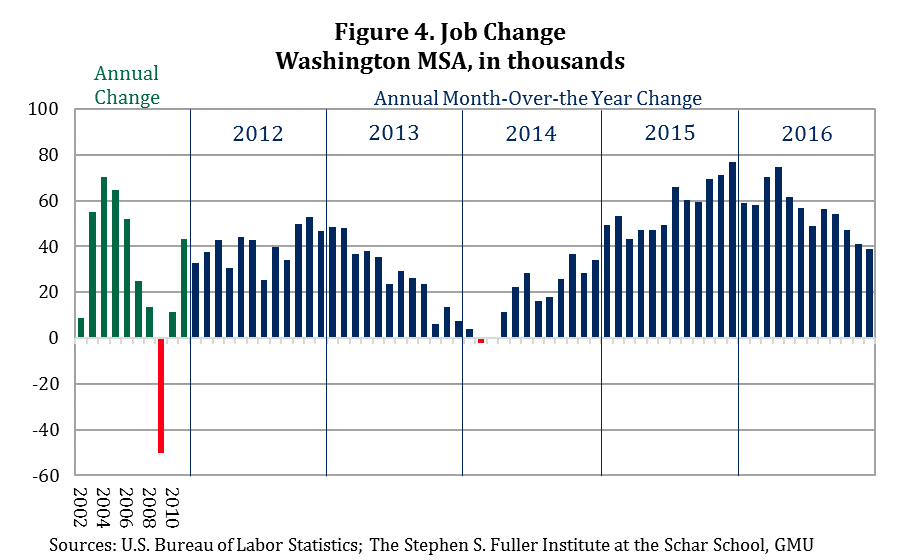
The job losses in both the federal government and the professional and business services sectors accounted for almost all of the direct jobs losses resulting from reductions in federal spending in response to the Budget Control Act of 2011. With the loss of federal payroll, estimated at $2.4 billion, and the payroll of laid off federal contractors, estimated at $6.9 billion, during the 12-months following the start of the Sequester in March 2013, local-serving sectors were negatively impacted. The pattern of job change in the Washington region for all sectors combined is shown in Figure 4. The slowdown in the economy’s generation of net new jobs in 2013 and the slow recovery in job growth following the first quarter of 2014 is unmistakable. For 2011, the Washington region added a total of 43,400 net new jobs, this slowed to 39,900 in 2012, and 28,100 in 2013. In 2014, job growth started off with no gain or losses for the first quarter and ended up adding 18,600 jobs for the full year. With the suspension of the Sequester at the end of FY 2014, job growth in the Washington region rebounded to 57,700 in 2015.
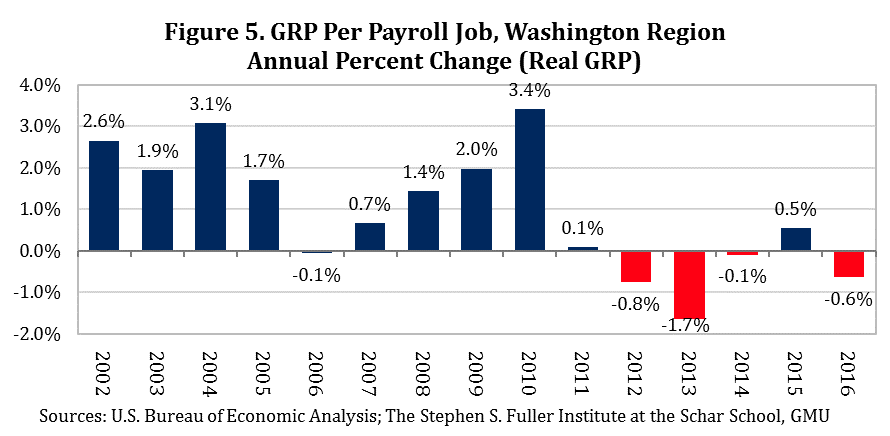
The reduction in federal spending and federally dependent jobs after 2010 fueled another change in the region’s economy; that is, the substitution of lower-value added jobs that were largely local serving for the higher-value added jobs supported by non-local markets (export-based jobs) that had been lost due to reductions in federal spending. The comparison of the average value added per job (+ 1.65% average annual growth) for all jobs within the Washington region prior to the Great Recession to the value added per job (-0.43% average annual decrease) for all jobs in the Washington region during the post-recession period, a period that coincided with decreases in federal spending, shows how quickly this shift has occurred and illustrates the significance of this shift that has resulted in the Washington region having the slowest growing economy among the nation’s largest fifteen metropolitan areas between the 2010-2015 period.
The Washington region also had the smallest rate of increase in per capita personal income during the 2010- 2015 period among the nation’s largest fifteen metropolitan areas; during the 2000-2006, period the Washington region’s per capita personal income growth rate ranked fourth among these metropolitan areas. This pattern of decreasing average value added per job also can be seen in sector-specific data, most importantly for professional and business services.
The threat of the Sequester and its possible economic impacts is likely to have dampened consumer demand in the form of deferred purchases and altered spending patterns for federal government employees and households dependent on federal contracting income as well as for non-federal workers. During the most recent Sequester, these changes were apparent in both day-to-day non-durable spending and longer-term investments, most notably home sales.
Average household spending on non-essential items, including dining and entertainment, decreased sharply between 2011 and 2014. While restaurant employment increased during this period, it appears these gains were primarily driven by household and population growth; the average household expenditure on food away from home decreased 12.6 percent between 2011-2012 (average) and 2014-2015 (average). Similarly, spending on entertainment decreased 14.0 percent from its pre-Sequester peak. The average household expenditure on personal care products and services had an even sharper decline, decreasing 22.2 percent. Altogether, an average household in the Washington region spent about $1,140 less on dining, entertainment and personal care items in 2014-2015 compared to 2011-2012. The share of the household’s spending on these items also decreased from 11.0 percent to 10.3 percent, as households increased expenditures on housing and health care.
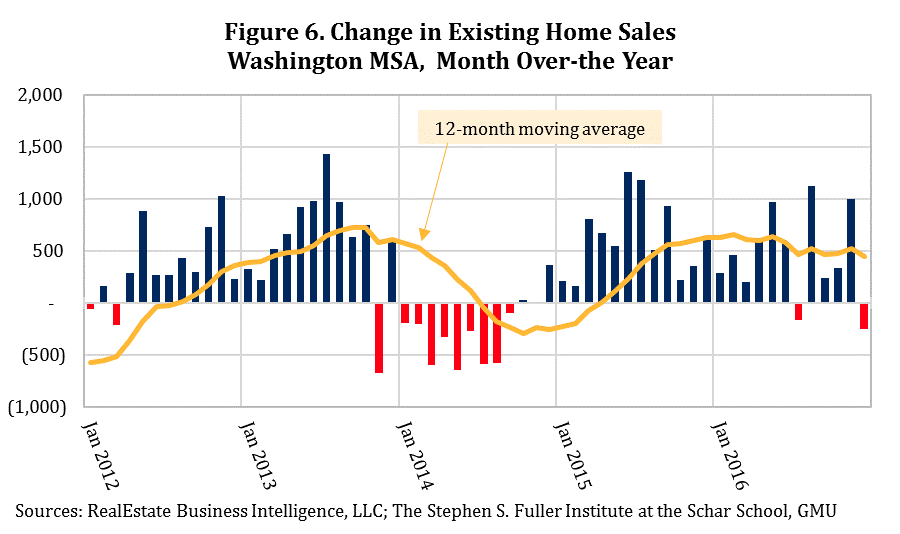
Households likely also delayed home sales and purchasing decisions as a result of the Sequester. Existing homes sales in the Washington region peaked in 2004 and decreased sharply each year through 2008. The post-Recession recovery was sluggish, but by 2012 the market had stabilized. As shown in Figure 6, existing homes sales increased each month starting in April 2012, accelerating in mid-2013.
However, in November 2013, the month after the federal shut-down, the number of closed sales decreased sharply. The decline in November 2013 was the first year-over-year decrease in since March 2012 and the sharpest decline since 2011. Sales rebounded the next month, but the shut-down marked a pivot point for home sales that extended through the end of 2014. The total number of homes sales in 2014 was 3,127 sales or 4.3 percent below 2013.
When homeowners are uncertain about the local economy or are threatened by unique circumstances and not easily quantifiable—in this case the Sequester and projected decreases in federal spending—it is common that households which might have been considering trading up to a more expensive house may decide to defer this move until the impacts of this unknown threat have been determined. Other prospective buyers may have felt that economic conditions were no longer certain enough to transition out of the rental market, delaying ownership until conditions improved.
Economic conditions improved in 2015 and the housing market partially regained its footing. Existing homes sales increased in both 2015 and 2016, but sales in 2016 were still 29.6 percent lower than the 2004 peak. In spite of the increased sales and relatively low inventory, home sale price growth was tepid. Between 2013 and 2016, the median sales price increased just 4.1 percent. In the prior three-year period (2010-2013), the median sales price increased nearly four times as much, rising 15.4 percent, with similar gains across all unit types.
This softening of the resale market also dampened the recovery of the new residential construction in the Washington region. Residential building permits for single-family structures decreased 8.3 percent (1,100 units) in 2014. The decrease in 2014 was the first since 2009 and brought single-family permits to just over one-half (55.9 percent) of the 1990-2010 average level.
The Sequester has had a lingering effect on the region’s housing market. Existing home sales declined after the October 2013 shut-down and the losses accelerated into 2014. New single-family home permits decreased simultaneously, as overall demand for ownership housing lagged. By 2015, these trends reversed but growth remained subdued through 2016, both in existing homes sales and prices and in new single-family permits. The types of jobs being added in the region, lagging wage growth, and overall household confidence in the region, all tied to Sequestration cuts, may have caused households to postpone home buying decisions during Sequestration and also in the years immediately following.
Differential Economic Effects of Reduced Federal Spending by Sub-State Area
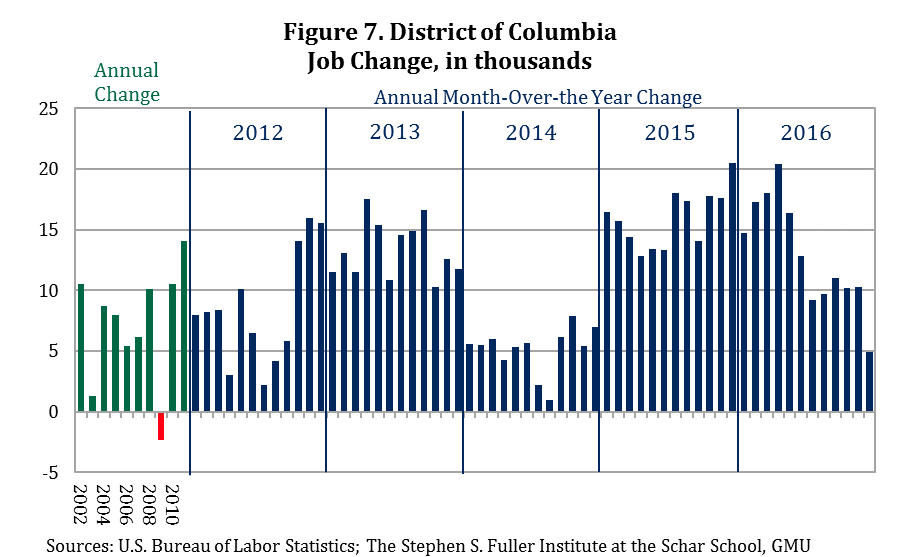
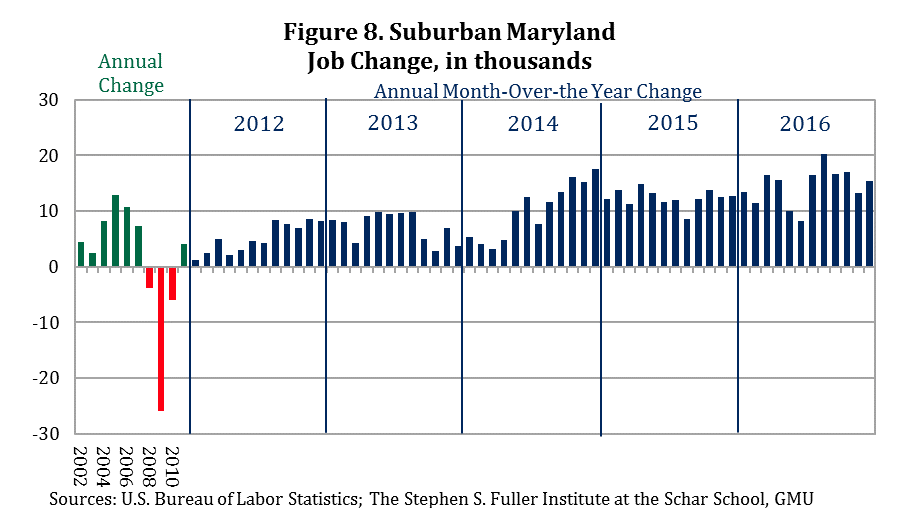
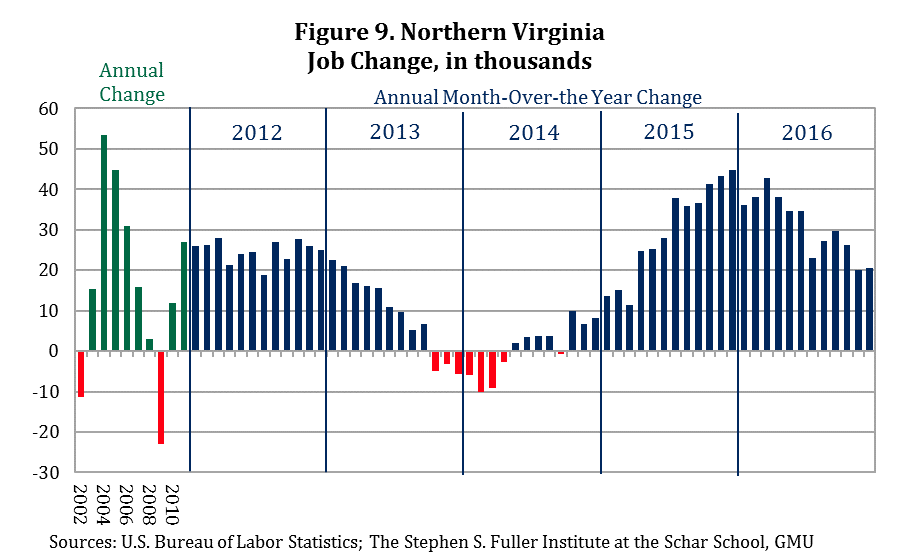
The economic impacts of decreased federal spending in the Washington region did not affect all jurisdictions equally. The jurisdictions where federal employees work are often not the same jurisdictions where these federal employees live. Similarly, federal procurement spending in the region varies across its jurisdictions by value and by type of service or product being purchased. The structures of the local economies also affect the magnitude of the local consequences of changes in federal spending within the Washington region. These differences are illustrated by the job growth effects of reductions in federal employment and federal procurement spending since 2010 as presented respectively in Figures 7, 8 and 9 for the District of Columbia, Suburban Maryland and Northern Virginia.
An examination of the job growth patterns occurring in the District of Columbia, Suburban Maryland and Northern Virginia show: (1) the timing of the job growth effect was different for each sub-state jurisdictions and (2) the magnitude of this job effect varied considerably. For the District of Columbia, the impacts were largely confined to losses of federal workers, most of whom did not reside in the District and so the loss of the consumer spending associated with this loss of employment was largely shifted to the suburbs. Similarly, the magnitude and types of federal procurement spending taking place within the District differ from those in Suburban Maryland and Northern Virginia. Much of the District’s federal procurement consists of office space rental, building maintenance and operations, and workforce support services, services that are not as subject to short-term reduction as the technical and management-related services that the federal government buys from contractors located in the suburbs. Still, the District’s overall employment growth rates declined by roughly fifty percent in 2014 compared to 2013.
Suburban Maryland is home to a wide range of independent federal agencies and federal headquarters functions for domestic agencies. Due to the smaller sizes and types of these federal functions, their local federal workforce was less affected by job reductions than departments and agencies located in the District and Northern Virginia, and Northern Virginia was the place of residence of a greater proportion of federal employees and federal contract workers negatively impacted by federal spending reductions. Additionally, the mix and magnitude of federal contracting in Suburban Maryland moderated its exposure to the negative impacts of federal spending deductions in comparison to Northern Virginia that had captured almost 48 percent of federal contracting dollars since 1980 and more than 60 percent of DOD’s procurement spending. Still, job growth in Suburban Maryland slowed during FY 2014 to less than 50 percent the level achieved in the prior year (see Figure 8).
Northern Virginia experienced the greatest negative effects on total job growth resulting from the Sequester among the region’s sub-state portions. The duration and magnitude of these job losses are clearly seen in Figure 9. Employment growth slowed each month in 2013 through the first three-quarters and then went negative for the last quarter. In 2014, job growth remained negative for four months and registered only small gains each month over the remainder of the year. It was not until April of 2015, that Northern Virginia job growth returned to pre-Sequester levels.
The Economic Cost of Federal Spending Reductions During the Sequester
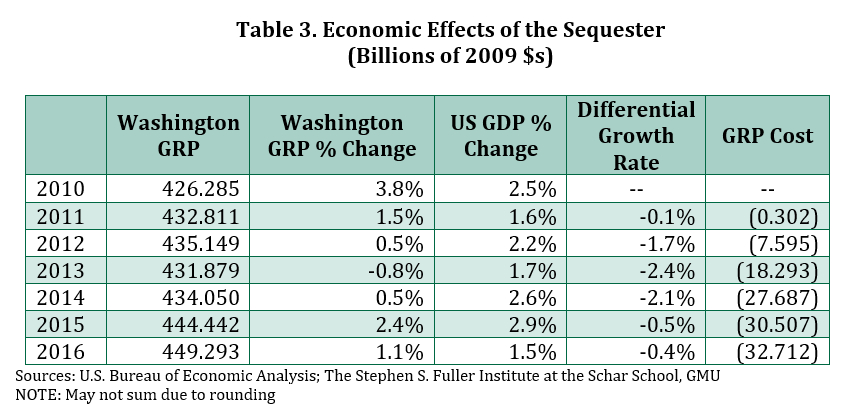
The combination of reductions in federal employment and federal procurement spending spanning 2011-2013 period and the collateral impacts on the Washington region’s economy had measurable impacts on its economic performance that have continued beyond 2013. The immediate economic effects translated into slower economic growth to an actual contraction of the economy in 2013 of 0.8 percent with a substantial below-average growth rate in 2014 and continuing below GDP annual growth rates to the present period. The costs of this below-average economic growth rate, including the 2013 contraction, are presented in Table 3 and shown graphically on Figure 10.
Each year that the Washington region under-performed due to spending reductions in its primary business—the federal government—resulted in lost gross regional product. Over the 2011-2016 period, this GRP loss totaled $117.1 billion. Had the Washington region’s economy tracked the U.S. GDP trajectory, rather than the one reflecting the full impacts of the Sequester, it would have totaled $482.005 billion in 2016, 7.3 percent larger than its actual $449.293 (in 2009$s).
These economic costs were spread across the Washington region reflecting the places of residence of the federal workforce and the distribution of federal contractors and their employees’ places of residence and the resulting spending patterns as these were affected by the federal spending reductions occurring since 2010. For the region, its economy contracted 0.8 percent in 2013; the economies of the District of Columbia and Suburban Maryland also contracted in 2013, by 0.2 and 1.2 percent respectively. Northern Virginia’s economy did not register any growth in 2013 and only a 0.1 percent gain in 2014; this compares to its 4.2 percent gain in 2010.