
The labor force consists of two components: employed residents and unemployed residents who have actively searched for a job during the prior four weeks. In the Washington region overall, both the number of employed and unemployed residents in 2018 have changed at rates that were consistent with their 2016 and 2017 trends. However, the sub-state trends have shifted:
- Suburban Maryland had more unemployed residents and fewer employed residents compared to April 2017;
- Northern Virginia and the District had fewer unemployed residents and more employed residents compared to last April; and
- The labor force trends in Suburban Maryland have become increasingly different than those in the rest of the region.
Altogether, this suggests that the population and workforce living in Suburban Maryland are responding to different factors than residents in the rest of the region. In upcoming posts, we will examine the county-level data and discuss what those trends might be.
Employed Residents
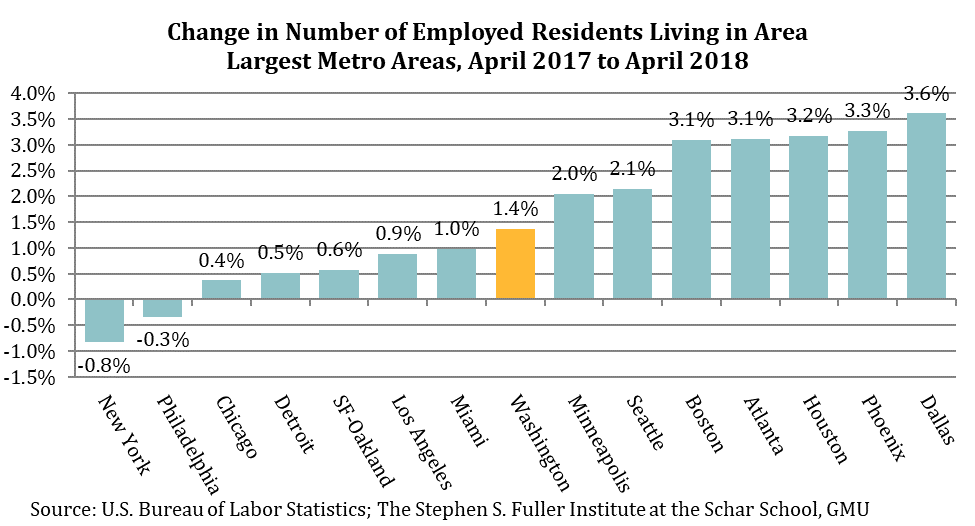
Between April 2017 and April 2018, the number of employed residents living in the Washington region increased by 44,440 people or 1.4 percent. Of the 15 largest metros, the region ranked eighth in terms of the percentage change in April. The region has ranked near the middle of the pack since 2016; during 2014 and 2015, the region ranked in the bottom one-third, including a last-placed ranking during 16 of those 24 months. Despite this relative improvement in rank for the region, the growth has become increasingly unequal across the sub-state areas.
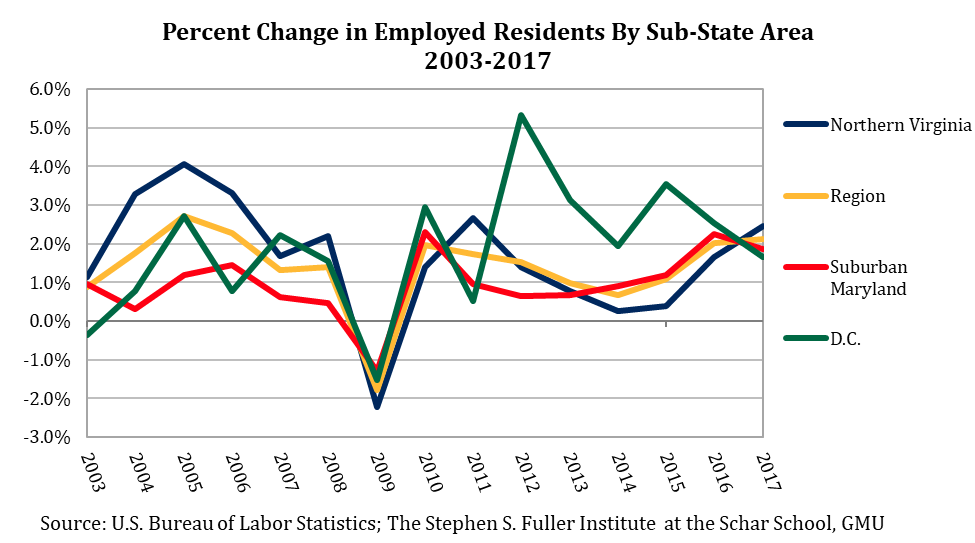
During 2016 and the first three quarters of 2017, growth in employed residents was consistent across the sub-state areas. The number of employed residents living in the region increased an average of 2.1 percent. Employed residents in Northern Virginia increased 2.0 percent, while those in Suburban Maryland and the District each increased 2.2 percent. These gains were uncharacteristically proportional.
Between 2012 and 2015, the growth rate in the District was larger than in the other two sub-state areas and reflected the overall population growth during that period. At the same time, the gains in Northern Virginia and Suburban Maryland were relatively proportional, except during 2012 when growth in Suburban Maryland lagged the rest of the region. During both the Recession (2009) and the recovery (2010), the employed resident gains and losses of each of the sub-state areas moved in parallel. Prior to the Recession (and in 2011), these trends were more inconsistent, with relatively sharper gains and losses in the District and Northern Virginia compared to the relatively steady increases in Suburban Maryland.
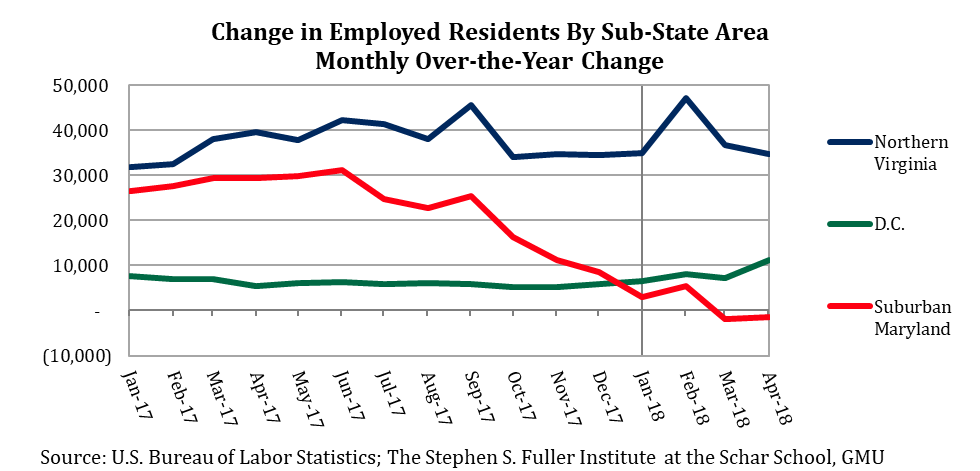
Between September 2017 and April 2018, the average growth in employed residents in the Washington region was 1.7 percent. Northern Virginia’s growth was an average of 2.4 percent, with relatively large increases in both September 2017 and February 2018. Growth in the District was an average of 1.8 percent but has followed an upward trajectory in 2018. Conversely, Suburban Maryland had an average growth of 0.7 percent, with a downward trajectory throughout the period. Between September 2016 and September 2017, the number of employed residents in Suburban Maryland increased 2.0 percent. This growth slowed and in both March 2018 and April 2018 there were fewer employed residents living in Suburban Maryland than compared to the same months in 2017.
Between April 2017 and April 2018, the increase in employed residents was driven almost entirely by gains in Northern Virginia and was the home to 34,820 of the 44,440 net new employed residents (78% of the total). The District’s increase of 11,205 employed residents accounted for one-quarter (25%) of the gain, while the loss in Suburban Maryland was equivalent to three percent of the region’s total increase. This reflects a shift in the post-Recession pattern. Between 2009 and 2016, Northern Virginia accounted for 41.3 percent of the increase in employed residents, Suburban Maryland accounted for 35.4 percent, and the District accounted for 21.9 percent.[i]
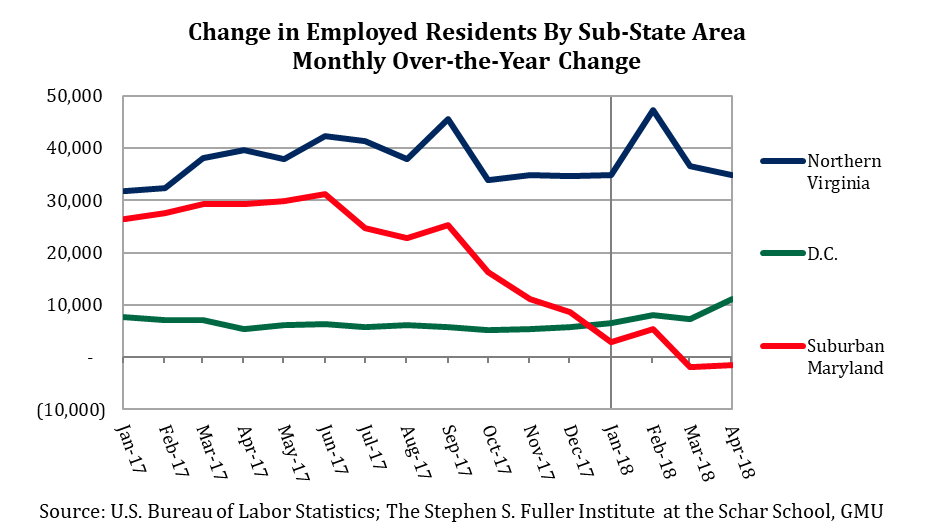
The slowdown in employed resident gains in Suburban Maryland that started in the summer of 2017 and accelerated in the fall was contrary to the trends in the rest of the region. During the first four month of 2018, Suburban Maryland has underperformed both its counterparts of D.C. and Northern Virginia, and its post-Recession average, suggesting an underlying shift in the workforce living in Suburban Maryland.
Unemployed Residents
The number of unemployed residents in the Washington region decreased by 7,740 people (-6.7%) between April 2017 and April 2018. This performance was somewhat weaker compared to 2016 (-10.3%), but stronger compared to 2017 (-3.5%). Altogether, the region-wide decrease in unemployed residents was in keeping with past patterns. However, the trends in the sub-state areas have shifted in recent months.
Regionally, the number of unemployed residents has decreased since 2010 and these decreases typically occurred for all three sub-state areas, with several exceptions. During 2011 and part of 2017, the District had year-over-year increases while the rest of the region had decreases, which has also been a more typical pattern for the past decade. In late 2016 and early 2017, Northern Virginia also had more unemployed residents compared to the prior year. For both the District and Northern Virginia, the 2016/2017 increase in unemployed residents coincided with increases in both employed residents and the overall labor force. Combined, this indicates that population growth and/or improved economic conditions bolstered the overall resident workforce, including those who had not yet found a job.
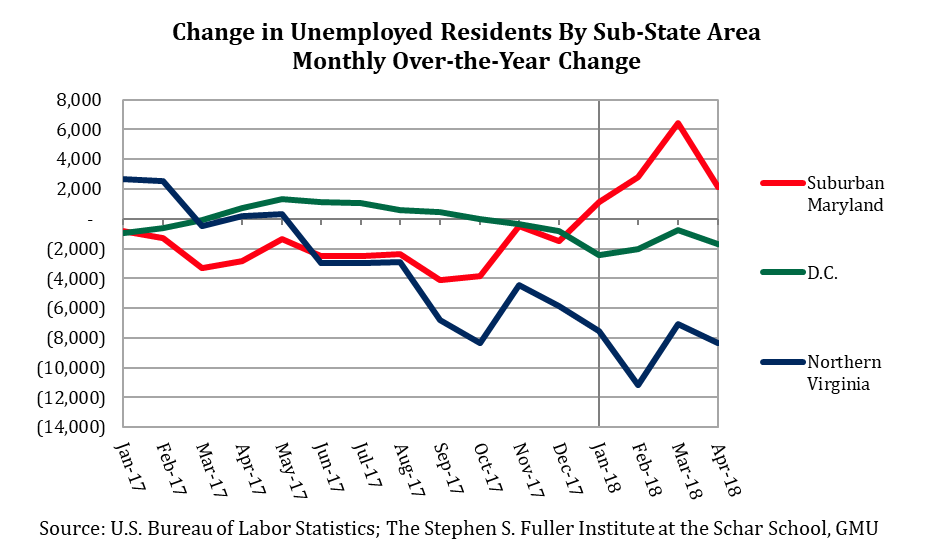
In 2018, both the District and Northern Virginia had fewer unemployed residents compared to the beginning of 2017. Since early 2017, trend in unemployed residents living in these sub-state areas has been improving, with sharper decreases in unemployed residents during the spring of 2018. In combination with the increasingly strong gains in employed residents living in these sub-state areas, the overall effect is that of an improving economy. The pattern in Suburban Maryland was the reverse: on a year-over-year basis, the number of unemployed residents increased during each month in 2018 and the number of employed residents decreased in both March and April. This suggests that trends affecting the workforce, or the population more broadly, living in Suburban Maryland differ substantively from those in both the District and Northern Virginia.
Conclusion
The labor force trends in Suburban Maryland in 2018 differ from those in the rest of the region: the number of employed residents decreased and the number of unemployed residents increased. Because the net increase in unemployed residents nearly equaled the net decreased in employed residents in Suburban Maryland, the overall labor force changed little (+656 people or 0.05%) in April 2018 compared to April 2017. The labor force trends may be the result of a combination of slower population growth, increased retirement rates for current residents, and/or changes in the mix of jobs in the region that may disproportionately affect residents in Suburban Maryland. The Stephen S. Fuller Institute will examine these potential trends in upcoming blog posts.
About These Data
These data are from the U.S. Bureau of Labor Statistics, the Local Area Unemployment Statistics series, as of May 30, 2018. The 15 largest metropolitan statistical areas are determined based on Gross Regional Product in 2016. This post was updated to correct a typo on 6/6/18,
[i] Jefferson, WV accounted for the remaining 1.5 percent.