
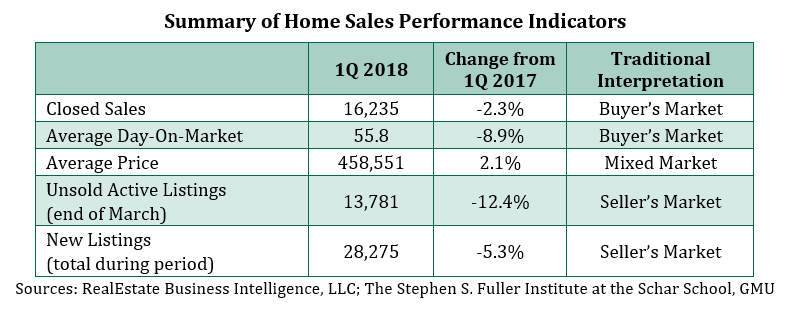
In the first quarter (1Q) of 2018, the Washington region’s housing market performance indicators were mixed. Closed sales decreased from last year, but the homes that sold were on the market for a significantly shorter period of time. The decrease in sales was likely the result of decreased supply and increased uncertainty that resulted from the federal budget standoff. Furthermore, the tight inventory and the low days-on-market did not translate to above average price gains. This combination of housing market performance is unusual for the region. Altogether, it suggests that the market is likely being disproportionately driven by a core group of motivated and discerning buyers, while weak inventory and economic uncertainty subdued the overall pool of buyers.
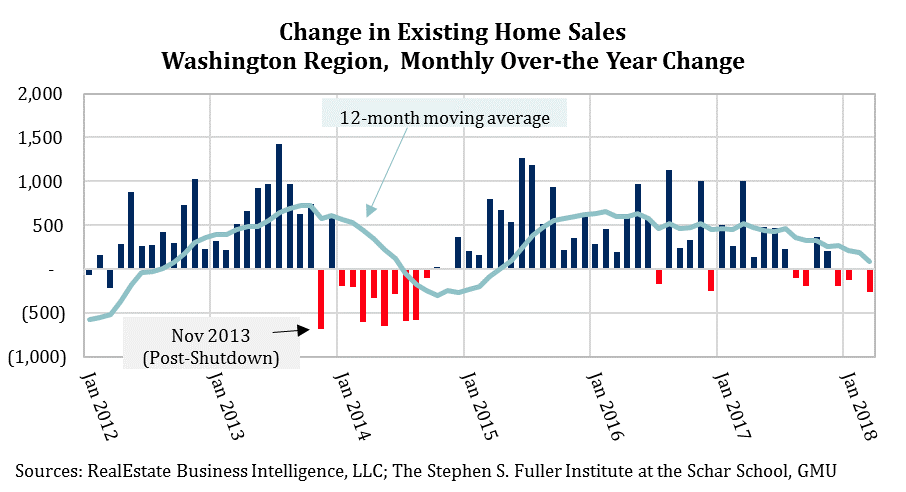
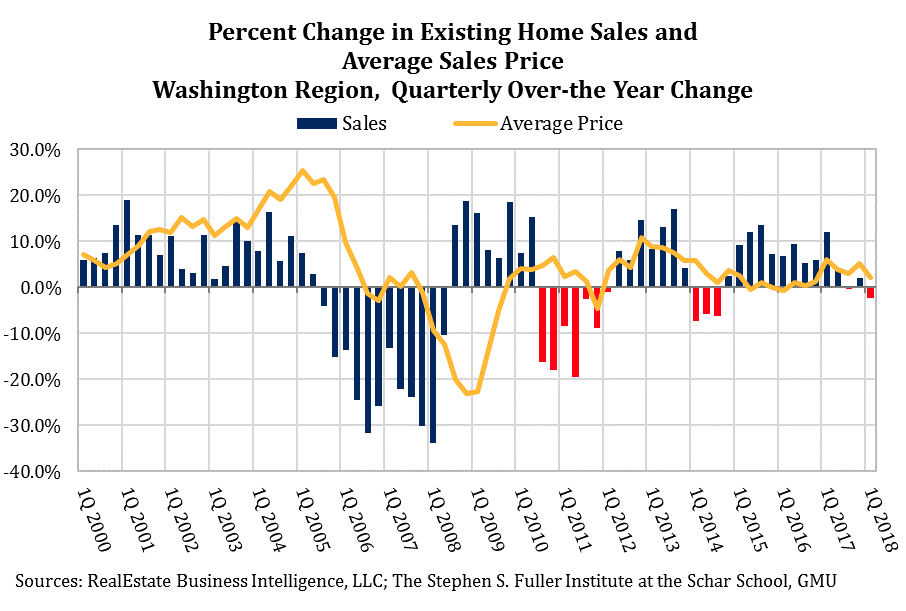
In the Washington region, there were fewer closed home sales in March 2018 compared to March 2017. During this period, closed sales decreased 3.6 percent, marking the fourth consecutive year-over-year decline. This is the longest period of consecutive decreases since 2014. The decreases during that period began in November 2013, the month after the October 2013 Shutdown. Sales had a short-lived rebound in December 2013 but then weakened for most of 2014.
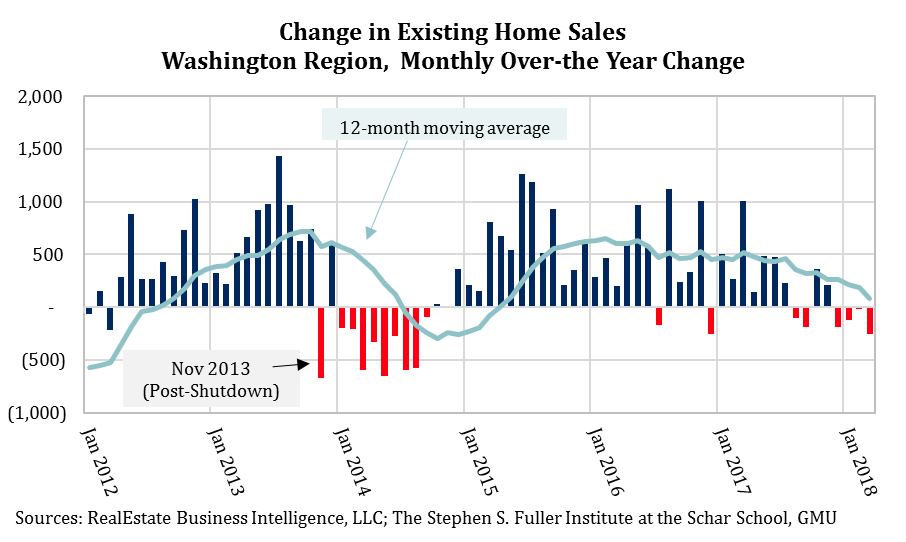
The decreases in closed sales in 2014 were likely due to a combination of the Sequester and overall economic uncertainty that resulted from the shifts in federal spending. A home purchase or sale is a long-term decision and a household may postpone the decision to do so during times of increased uncertainty.
Federal budget uncertainty was also likely playing a role in the home sales declines in recent months. The federal budget standoff resulted in a series of shutdown threats starting in April 2017 and accelerating in October 2017. While the resulting shutdowns in December 2017 and February 2018 were short, the overall effect of the rolling threat of a shutdown and the federal deadlock that it reflected likely subdued consumer confidence and expectations in the region.
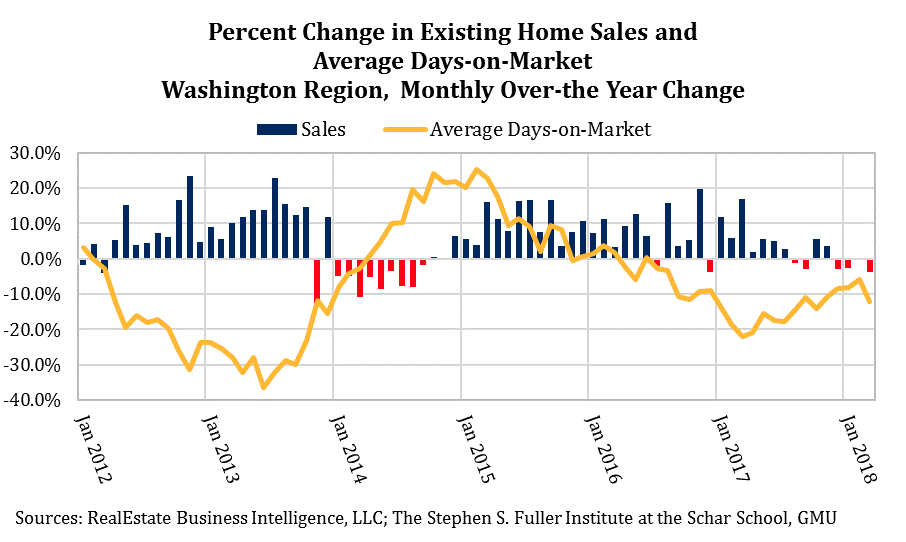
However, the homes that sold were on the market for fewer days on average. In March 2018, sales closed in an average of 49.7 days, about a week (6.9 days) faster than in March 2017. Typically, changes in closed sales and days-on-market move in opposite directions reflecting a consistent picture of buyer demand. This was the case in 2014: as closed sales decreased, the average days-on-market climbed. As buyer demand returned in 2015, the trend for the average days-on-market reversed. Similarly, as closed sales weakened during 2017, the decreases in the days-on-market moderated. March 2018 deviates from this trend. The decline in closed sales was sharper than in prior months but the average days-on-market also decreased sharply.
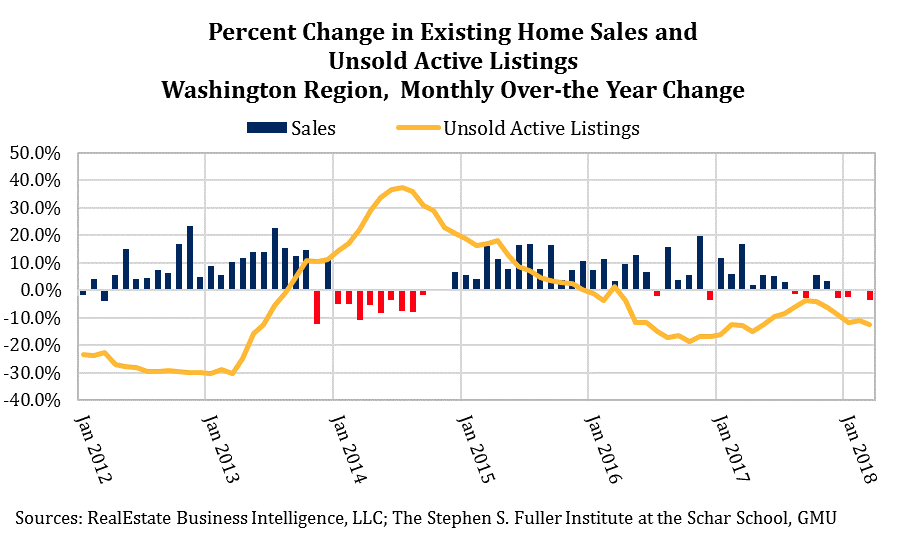
The recent shift suggests a combination of inventory and buyer selectivity factors that is resulting in fewer, but faster, closed sales. Unsold active listings increased when closed sales weakened in 2014; this shift was primarily the result of weakening demand instead of accelerated gains in new listings. As buyer demand returned in 2015, the number of unsold active listings decreased as they were either bought or removed from the market.
Most of 2017 appeared to be repeating this pattern: as closed sales weakened, the decrease in unsold listings slowed. Despite the continuing weakness in sales, the decline in unsold active listings accelerated in November 2017. New listings drove this shift; the number of new listings decreased from the same month in the prior year starting in November 2017, a trend that has continued through March 2018. In March 2018, new listings were 7.6 percent below their March 2017 level. The increasingly tight inventory is likely playing a role in the decrease in closed sales.
The average price of a closed sale in the 1Q 2018 increased 2.1 percent from 1Q 2017. In January 2018, the average price increased 2.2 percent from last year. The average price in February decreased 0.6 percent and the price increased 3.9 percent in March. The average price trend tends to be somewhat volatile and sensitive to the mix of sales so the three-month average shown below to smooth the trend.
The average price increase in 1Q 2018 was weaker compared to the gain in 2017 but stronger than the gains in both 2015 and 2016. Compared to the long-term historic average, the 1Q 2018 gain was about one-half the increase of the annualized growth between 2000 and 2017. This long-term average is calculated using just the 2000 and 2017 average price so the boom and the bust are only incorporated to the degree that they affected the prices in 2017.
Typically, periods of low days-on-market and low inventory correspond with larger increases in prices. By contrast, periods of decreasing closed sales typically have smaller price gains. The 1Q 2018 growth is more in line with the changes that occur during times of decreased sales, suggesting that buyers have more market power than the tight supply would indicate.
In combination, the housing market performance indicators reflect a mixed market, especially in comparison to historic trends. The overall level of buyer activity was subdued, likely because of a combination of inadequate inventory and increased general economic uncertainty. By contrast, the buyers in the market were highly motivated and ready to quickly purchase a home; this was not the case during the last period of weakening demand in 2014. In aggregate, however, even these highly motivated buyers did not drive up prices to the degree that may be suggested by the inventory and the days-on-market metrics. Altogether, it appears that a core group of highly motivated, discerning buyers was disproportionately driving the recent market.
About These Data
Data in this post are from RealEstate Business Intelligence, LLC as of April 12, 2018. The Washington region is the 2013 delineation of the metropolitan statistical area.