Download as a PDF>>
Download the Schar School Stat as an image>>
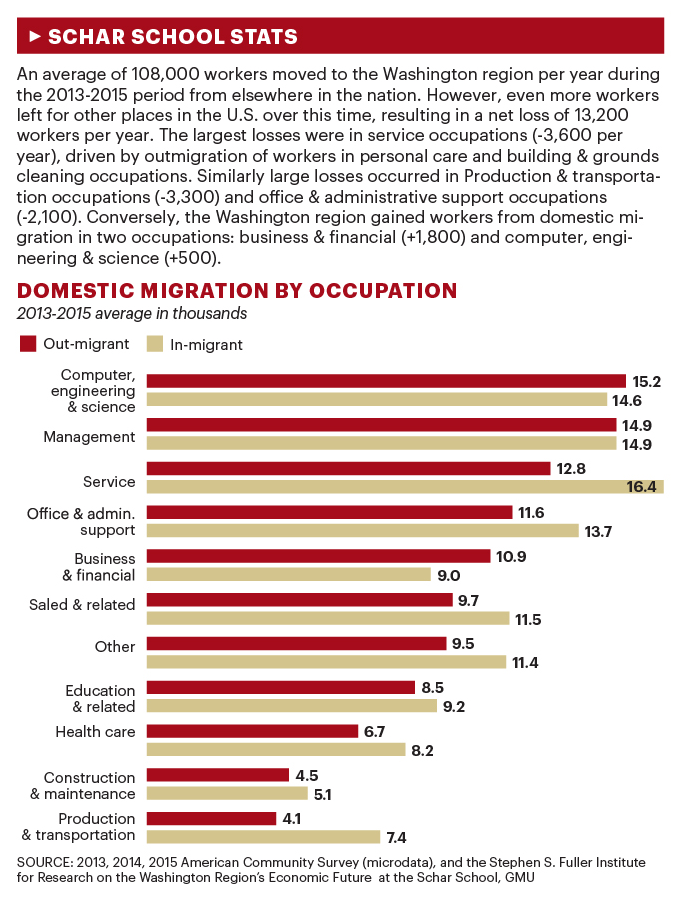
Between 2013 and 2015, the greater Washington region gained 108,000 workers per year from elsewhere in the U.S. During the same period, the region lost 121,200 workers who moved out of the region to other parts of the nation. An analysis of these movers by industry is available on page 35 of Migration in the Washington Region: Trends between 2000 and 2015 and Characteristics of Recent Migrants released in September 2017. This blog post explores what occupations these workers held and is adapted from the Schar School Stat that ran in the Dec. 1, 2017 edition of the Washington Business Journal.
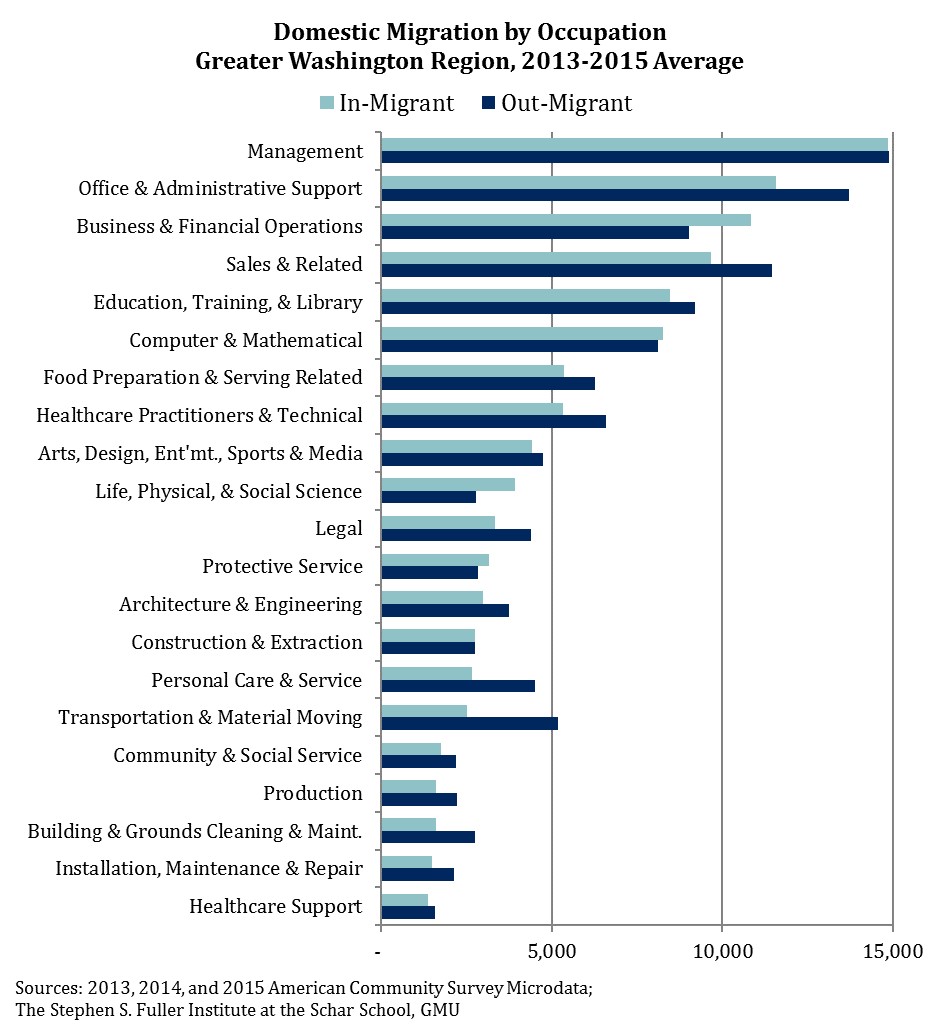
The most common occupation for both in-migrants and out-migrants was Management. About 14,870 workers in Management occupations moved to the region each year from elsewhere in the nation. Similarly, 14,900 workers left for other parts of the U.S. each year. As a result of domestic migration, the number of workers in Management occupations was nearly unchanged and the region lost a net of 30 workers per year.
Office & Administrative Support occupations had the second largest domestic migration flows; the greater Washington region had 11,580 domestic in-migrants and 13,720 domestic out-migrants per year. The resulting net loss of 2,140 workers was the second largest net loss, behind Transportation & Moving occupations (-2,680).
The third largest domestic inflows were workers in Business & Financial Operations occupations (+10,850 people). By contrast, the region only lost 9,030 workers in these occupations. The greater Washington region gained a net of 1,820 workers in Business & Financial Operations, the largest net increase of any occupational group.
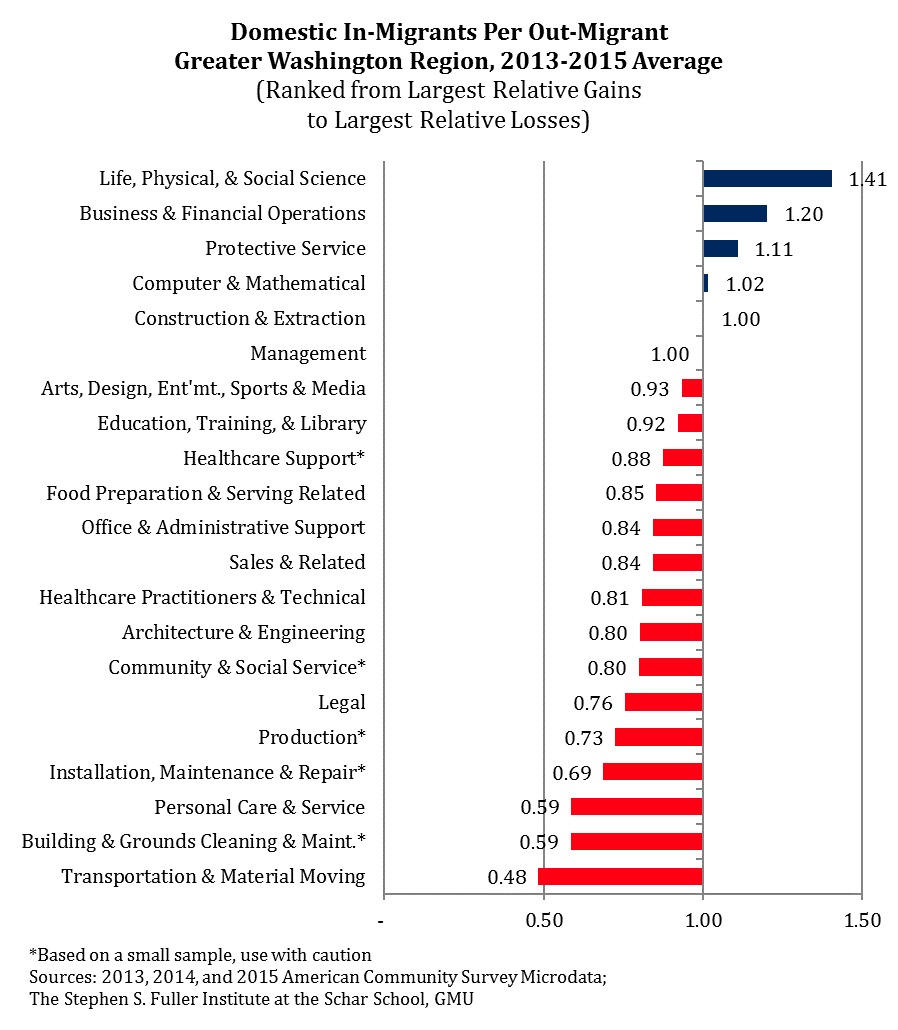
Overall, the greater Washington region had net in-migration in just four[1] occupations:
Life, Physical, & Social Science, Business & Financial Operations, Protective Service, and Computer & Mathematical occupations. The largest relative gain was in Life, Physical, & Social Science occupations. There were 3,930 domestic in-migrants and 2,800 out-migrants, or 1.41 in-migrants for every out-migrant.
By contrast, the largest relative net losses were in Transportation & Material Moving occupations, which had 2,510 in-migrants and 5,190 out-migrants, or 0.48 in-migrants per out-migrant. Building & Grounds Cleaning & Maintenance occupations and Personal Care & Service occupations had similar ratios, with 0.59 in-migrants per out-migrant.
Of note, Legal Services and Architecture & Engineering occupations also had relatively high rates of net domestic out-migration, despite our region’s overall concentration in these jobs. The greater Washington region gained 3,340 domestic in-migrants in Legal occupations on average between 2013 and 2015 but lost 4,410 workers to domestic out-migration, a ratio of 0.76 in-migrants to every out-migrant. Similarly, there were 3,000 domestic in-migrants and 3,740 domestic out-migrants during the same period or 0.80 in-migrants per out-migrant.
About These Data
This section examines the characteristics of migrants in the greater Washington region using the American Community Survey public use microdata from the U.S. Census Bureau. The recent characteristics of movers are shown averaging the responses from the 2013, 2014 and 2015 surveys to create a more robust estimate. The public use microdata areas do not align with metropolitan areas and the closest proxy was used. For The greater Washington region a map, please click here.
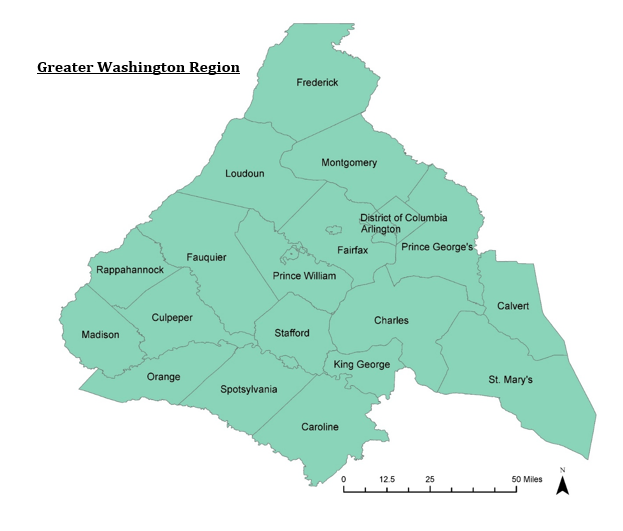
[1] Construction & Extraction occupations had essentially equal domestic in-migration (2,764) and out-migration (2,755).