The real per capita personal income (PCPI) measures wealth, the cost of living [i] and inflation by metro area. It allows for more comprehensive comparisons, both over time and between geographies, by accounting for regional cost of living and changes in price levels. Compared to 2008, the Washington region’s real PCPI was only 1.0 percent higher in 2015, as a result of both higher increases in the cost of living (regional inflation) and slower growth in unadjusted incomes compared to the national average. During this period, real PCPI growth in the Washington region lagged all of the largest metro areas [ii] except Miami.
The cost of living in the Washington region remained high throughout the 2008-2015 period. In 2008, price levels were 18.7 percent higher than the national average; by 2015, price levels had risen to 19.1 percent higher. While the Washington region’s cost of living did not rise more quickly than PCPI during this period, price growth did moderate the increase in real incomes and will likely continue to be a concern for the region in the future.
Per Capita Personal Income and Real Per Capita Personal Income
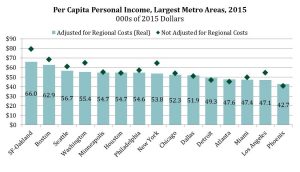
In 2015, the per capita personal income in the Washington region was $64,882 and the third highest of the largest metro areas, behind San Francisco-Oakland and Boston. However, after adjusting for the regional cost of living and inflation, the real PCPI in the Washington region was $55,351. In real terms, the Washington region ranked fourth, falling behind Seattle which had a lower cost of living.
Compared to 2014, the real PCPI in the Washington region increased 3.6 percent, the largest gain for the region in the eight years of this data series. Of the largest metro areas, the Washington region had the sixth largest percentage increase, marking the first time since 2009 that the region has outperformed more than one-half of the largest metro areas.
As a result of this relatively strong growth, the real PCPI in the Washington region surpassed that in Houston and the Washington region improved in rank from the fifth highest real PCPI in 2014 to the fourth highest in 2015. Houston dropped from its fourth place rank in 2014 to sixth in 2015. Houston’s real PCPI growth was the lowest of all the largest metro areas, increasing 0.6 percent.
Despite these gains, the real PCPI Washington region has not returned to the third place rank that it maintained from 2008 through 2012. In 2013, the real PCPI in the Washington region decreased 3.8 percent, the largest drop of any metro. As a result, Seattle surpassed the Washington region in 2013. The Washington region was also surpassed by Houston in 2014, as Washington also the smallest growth in real PCPI of the largest metro areas in 2014. The improvement in rank in 2015 is a reversal of the decline during the 2013-2014 period, but growth in real PCPI in the Washington region will need to outpace growth in Seattle by at least 2.4 percentage points to return to the third place rank in 2016.
Real Per Capita Personal Income Change Since 2008
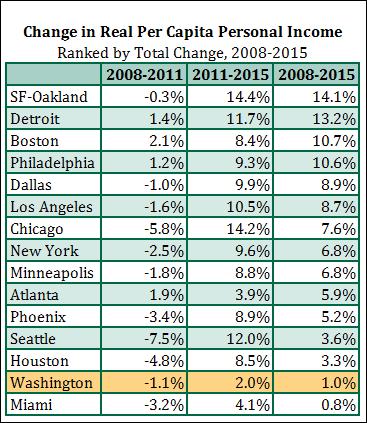
Compared to 2008, the real PCPI in the Washington region increased just 1.0 percent in 2015 and underperformed all of the largest metro areas except Miami (+0.8 percent). Miami was the last metro to return to its 2008 level real PCPI and did so in 2015; all other large metro areas had fully recovered by 2014. In the Washington region, the real PCPI exceeded its 2008 level in 2012 but then sharply declined in 2013. The real PCPI in most of the largest metro areas decreased between 2012 and 2013, but the Washington region was the only one that did not make up all its losses in 2014.
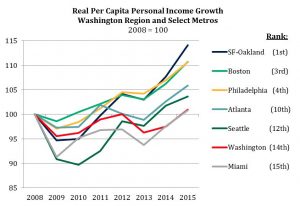
The real PCPI in Seattle had the largest continuous decline as a result of the recession. Conversely, the real PCPI in Boston had fully recovered by 2010 and its losses in 2009 were modest. Between 2008 and 2015, San Francisco-Oakland had the largest growth, rising 14.1 percent, followed by Detroit (+13.2 percent) and Boston (+10.7 percent). Growth in these metros accelerated in 2014, but they began outperforming most metro areas in 2011. For a table showing the real PCPI growth for all of the largest metros, see the Additional Tables.
Regional Price Levels
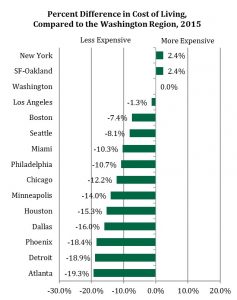
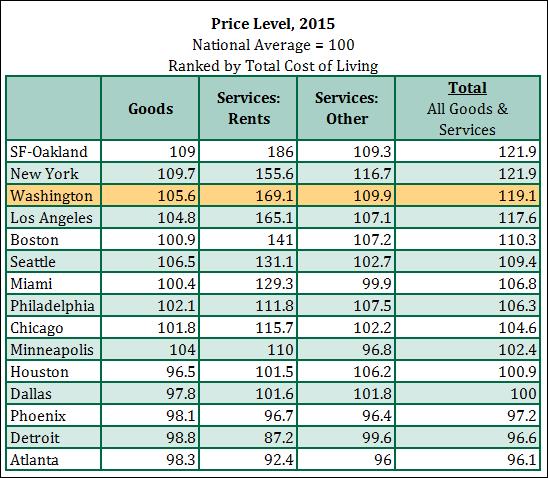
In 2015 in the Washington region, price levels were 19.1 percent higher than the national average. Only two of the largest metro areas had higher price levels: New York and San Francisco-Oakland, which each had prices that were 21.9 percent higher than the national average. Overall, these two metros were 2.4 percent more expensive than the Washington region.
All of the remaining largest metro areas were less expensive than the Washington region. Los Angeles, the fourth ranked metro, was 1.3 percent less expensive than the Washington region. Three of the largest metro areas had price levels that were less than the nation: Phoenix, Detroit and Atlanta. Compared to the Washington region, these metro areas were between 18 and 20 percent less expensive.
Regional price levels are divided into Goods, Services: Rents, and Services: Other. The regional price level of Goods in the Washington region was only 5.6 percent higher than the national average in 2015 and the fourth highest of the largest metro areas. Rents were 69.1 percent higher in the Washington region compared to the national average. Rents in the Washington region were the second highest of the largest metro areas, only behind San Francisco-Oakland. The price level of Services: Other was 9.9 percent higher than the national average, ranking second of the largest metro areas in 2015. For a table showing the price levels for all of the largest metros, see the Additional Tables.
Regional Inflation
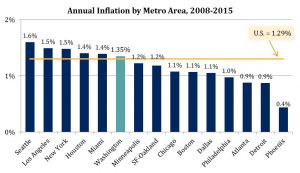
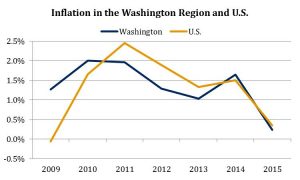
Between 2008 and 2015, the Washington region had an average of 1.35 percent regional price inflation. Inflation in the Washington region was slightly higher than national inflation during this time. So, in addition to higher-than-average absolute price levels, the Washington region also had higher-than-average increases in prices in the past eight years.
Of the largest metro areas, the Washington region had the sixth highest inflation since 2008. Seattle had the highest inflation (+1.6 percent), followed by Los Angeles and New York (+1.5 percent each). The majority of the largest metro areas had inflation that was below the national rate.
Inflation in the Washington region was not consistent over the period. In 2009 and 2010, inflation was significantly higher than the national average. Inflation in the region slowed over the following three years and remained about 0.5 percentage points below the national average. Inflation in the Washington region picked up in 2014 and followed national trends in both 2014 and 2015.
Conclusion
The Washington region had one of the highest real per capita personal income in the nation in 2008, ranking 14th of all the 383 metro areas in this dataset. But price levels were also among the highest in the nation in 2008 (10th of 383) and increased more than the national average. In 2015, the Washington region’s real PCPI had slipped to 18th, partly reflecting the rise in the cost of living, which ended the period as the 8th highest of all the metro areas in the nation.
In the near-term, the Washington region is forecasted to have a slowdown in economic growth that may result in less growth in incomes, as well. Based on the pattern in 2011-2014, price growth in the region also may moderate in the near-term in response to this weaker growth in incomes. However, the moderation in price growth, at least historically, has been less than the moderation in income growth (i.e. prices increase somewhat faster compared to incomes). Thus, the real per capita personal income in the Washington region will likely have weak growth going forward. Similar to employment growth, 2015 may have been one of the strongest gains for the Washington region’s real PCPI for the decade.
About These Data
These data are from the U.S. Bureau of Economic Analysis. Regional real per capita personal income is from the June 22, 2017 release. Regional per capita personal income is from the November 17, 2016 release. National inflation was calculated using the national personal consumption expenditures indices from the U.S. Bureau of Economic Analysis released on May 26, 2017. The same inflation factor was used to convert the chained 2009 dollars to 2015 dollars for the real per capita personal income. Regional price parities price levels are referred to in this post as regional price levels.
[i] A note on the difference between the cost of living and the regional price levels as measured by regional price parities: Regional price parity measures the relative price level of a metro area and differs from a true “cost of living” in that it measures the average cost of the “average” goods and services consumed by a household in the region but (1) does not take into account variations in this bundle by household and (2) does not include other factors that affect a household’s wellbeing, including everything from variations in quality of public good/services, like public schools, to variations in quality of life indicators like the environment. References to the cost of living in this post only include differences in the average regional price levels.
[ii] measured by Gross Regional Product in 2015
Additional Tables
This post was updated on 6-27-17 with the note on the difference between the cost of living and the regional price levels [i].